This appendix contains district-level maps of the probability of dying between birth and 80 years of age in 2019 and change from 2002 to 2019 from specific causes of deaths, which supplement the text in Chapter 7 and Chapter 8. Note, there are two sets of maps for all other cancers, one for each chapter. The all other cancers group for Chapter 8 contains fewer deaths because the group from Chapter 7 had been divided to include more site-specific cancer groups.
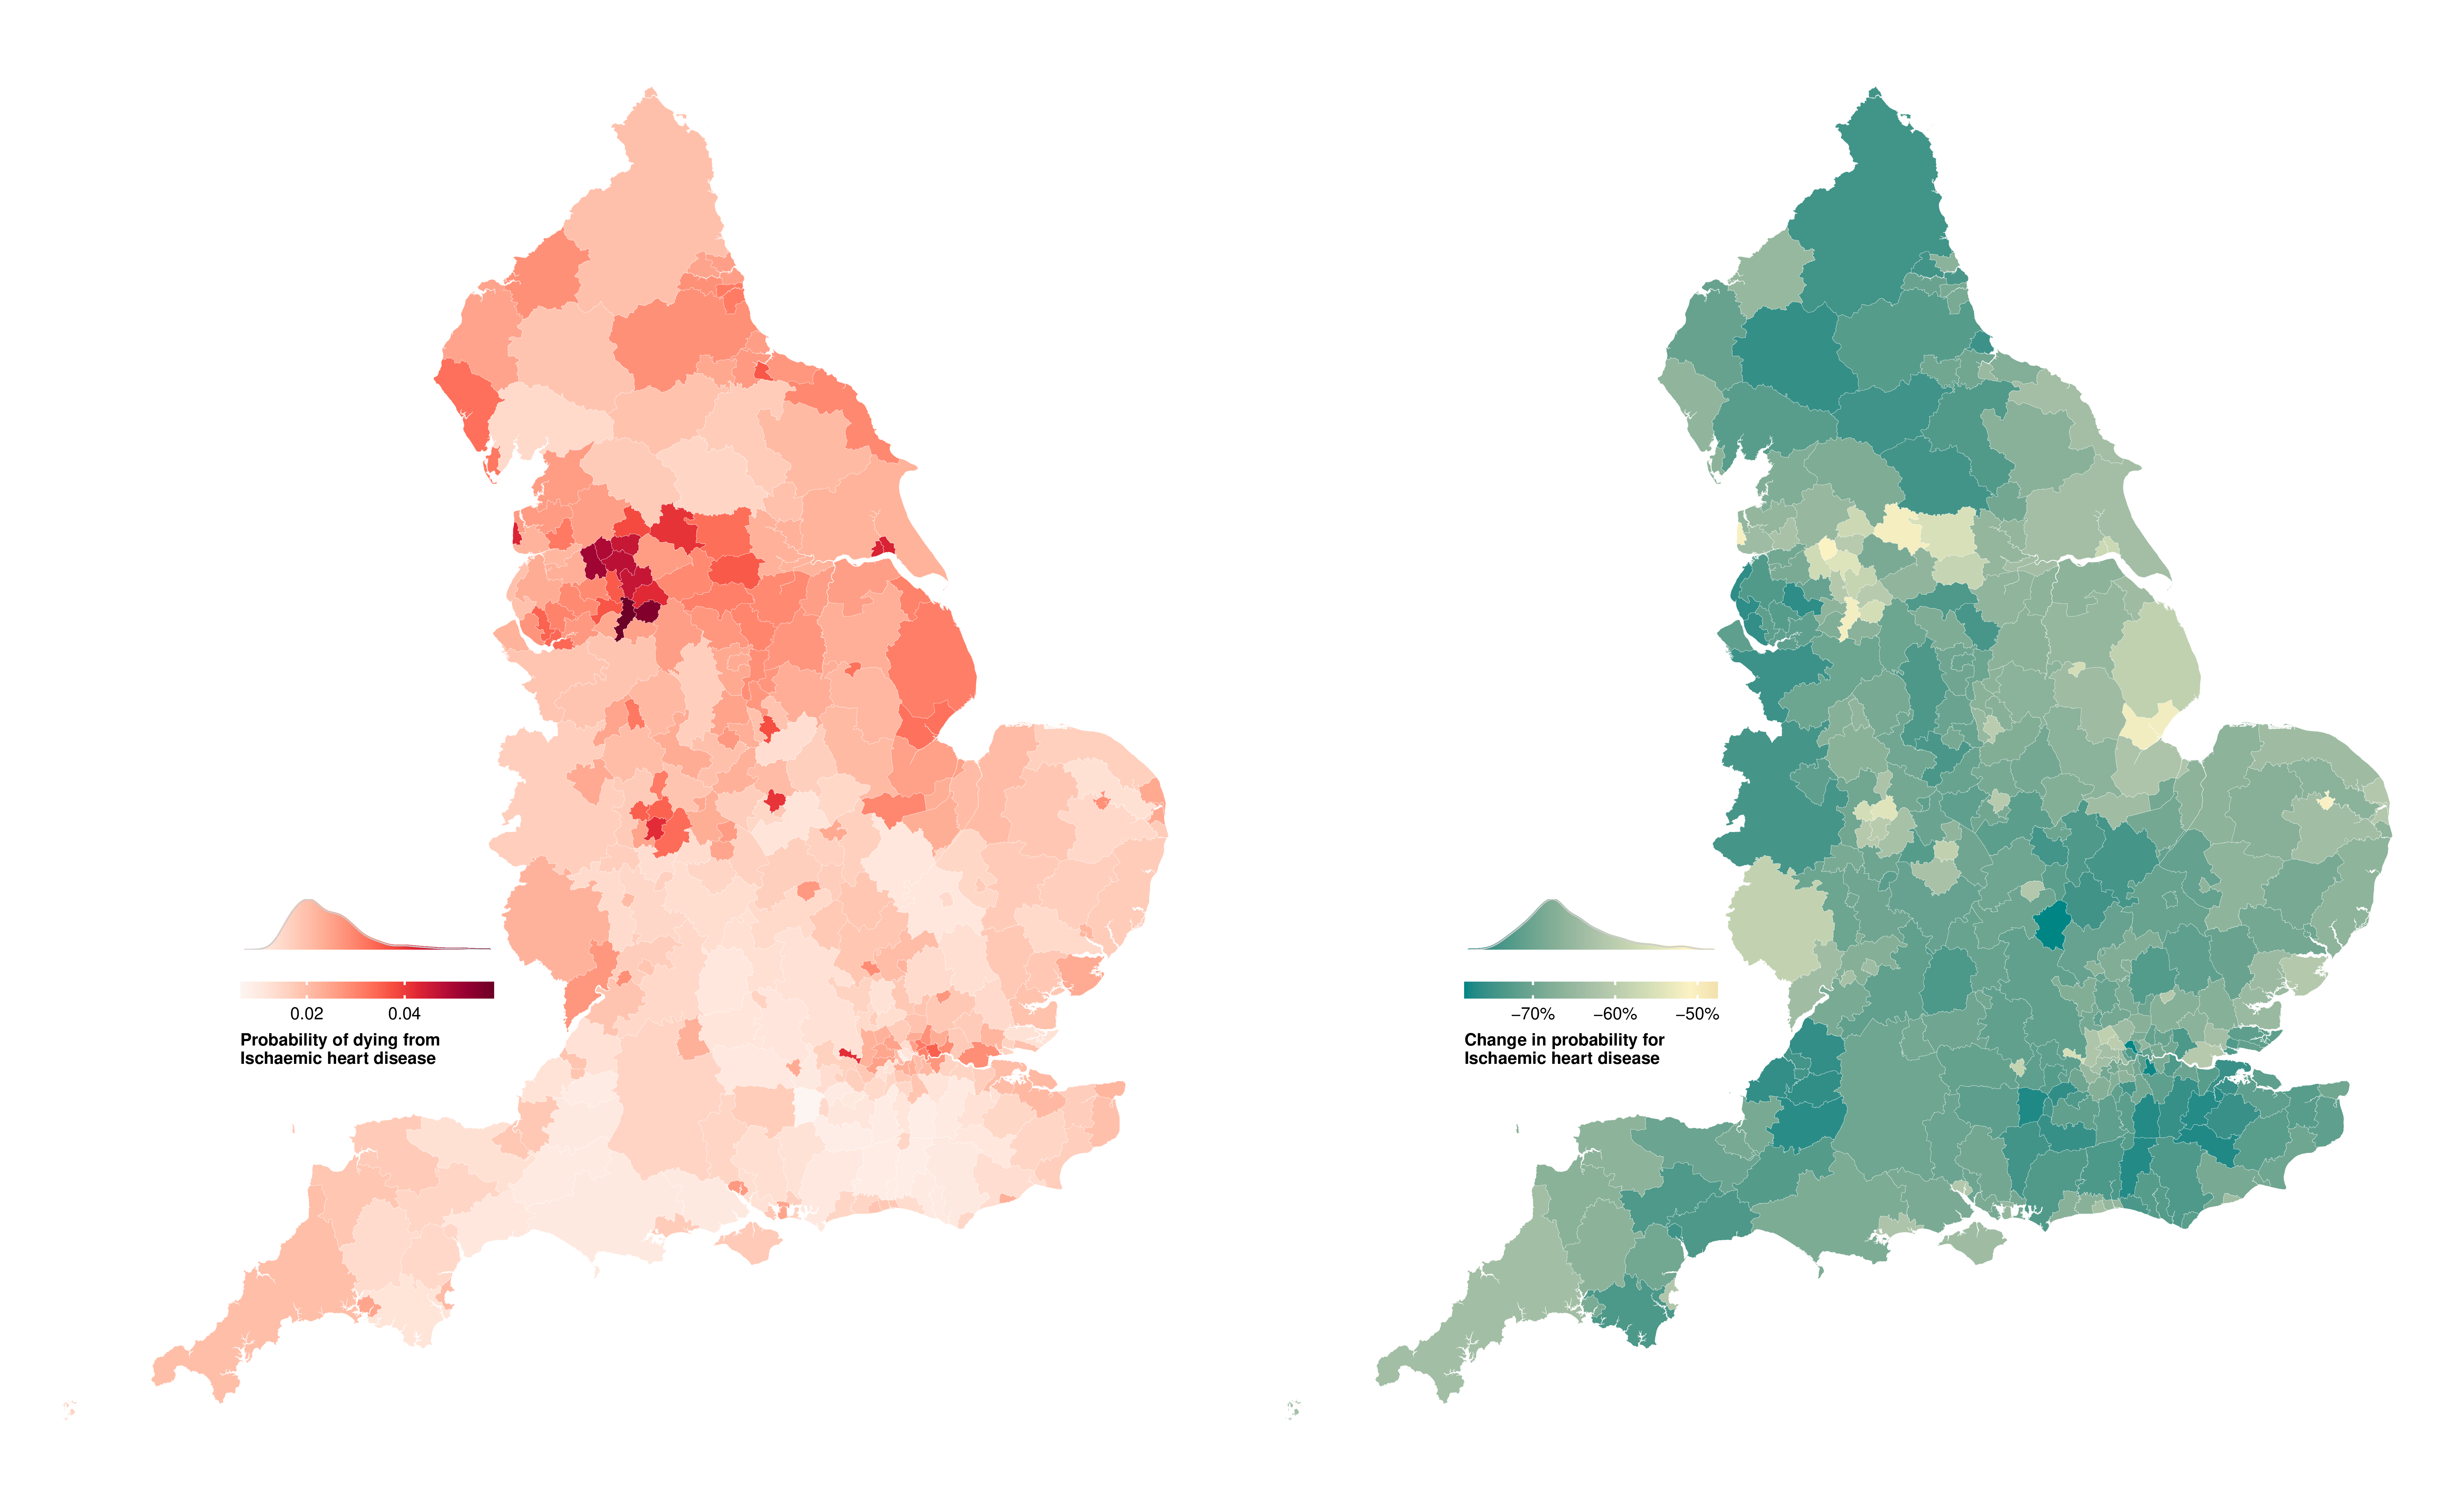
(a) Women
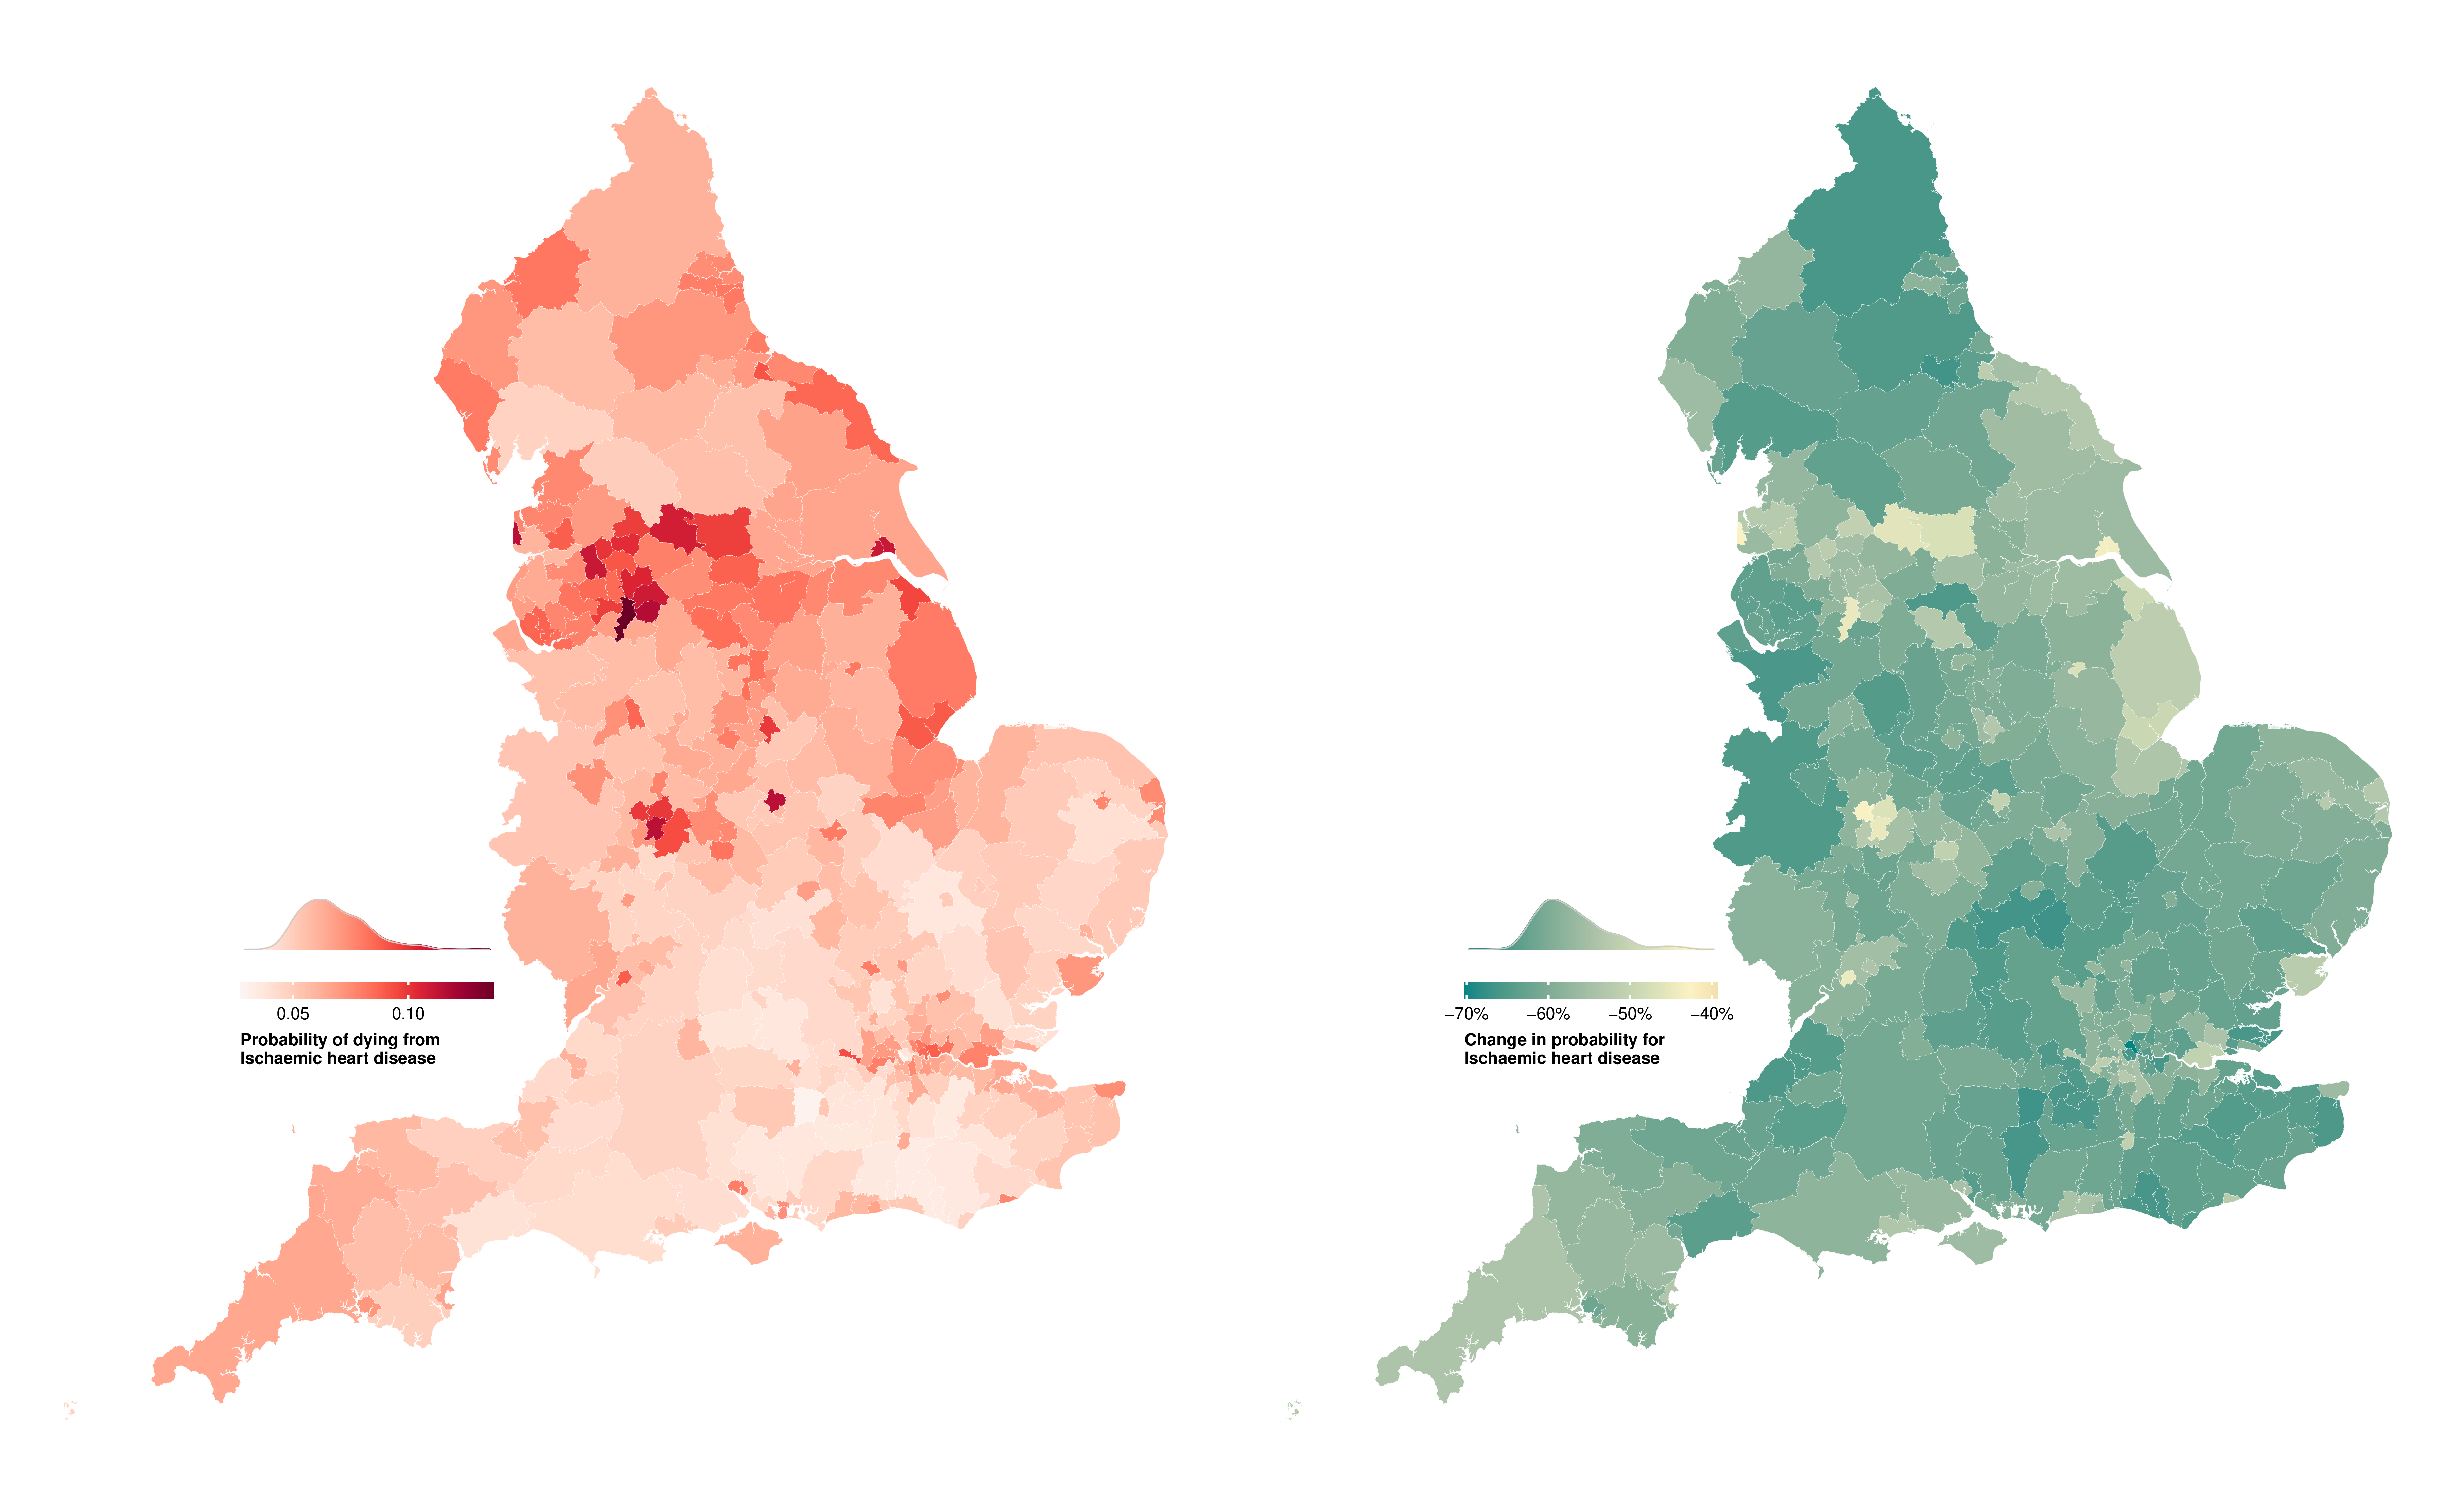
(b) Men
Figure E.1: Probability of dying from ischaemic heart disease between birth and 80 years of age in 314 local authority districts in England in 2019 and change from 2002 to 2019.
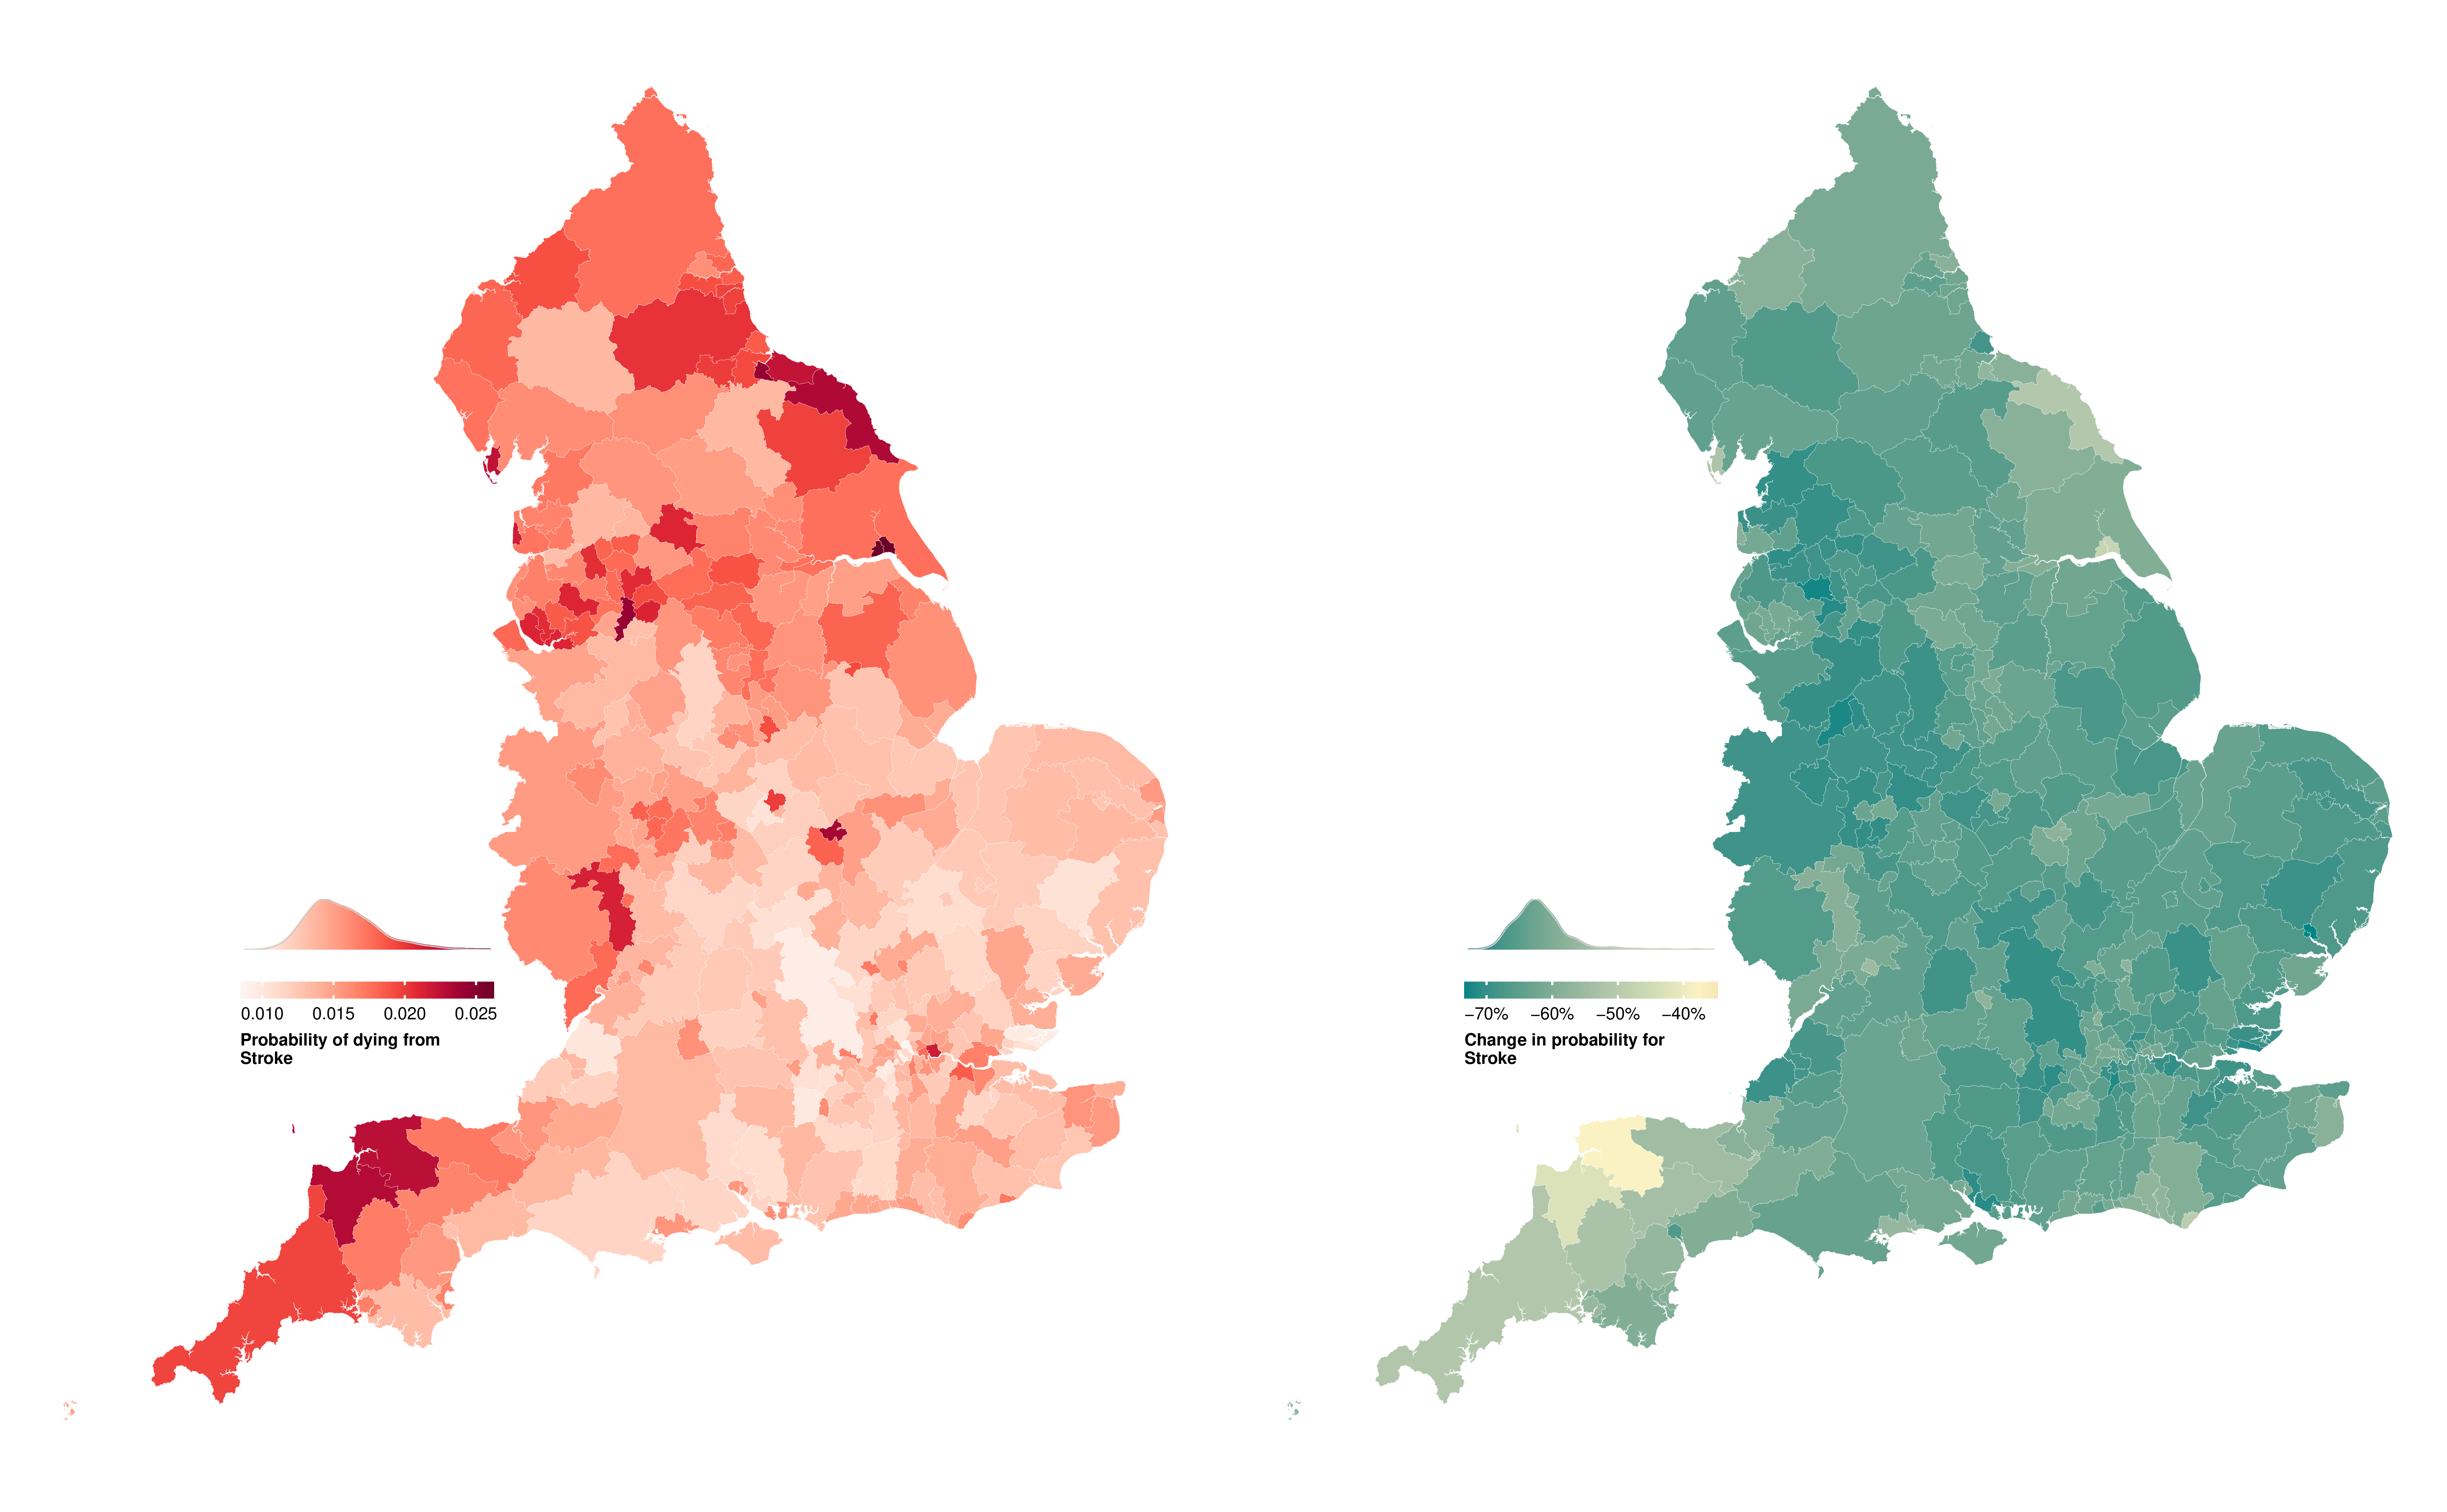
(a) Women
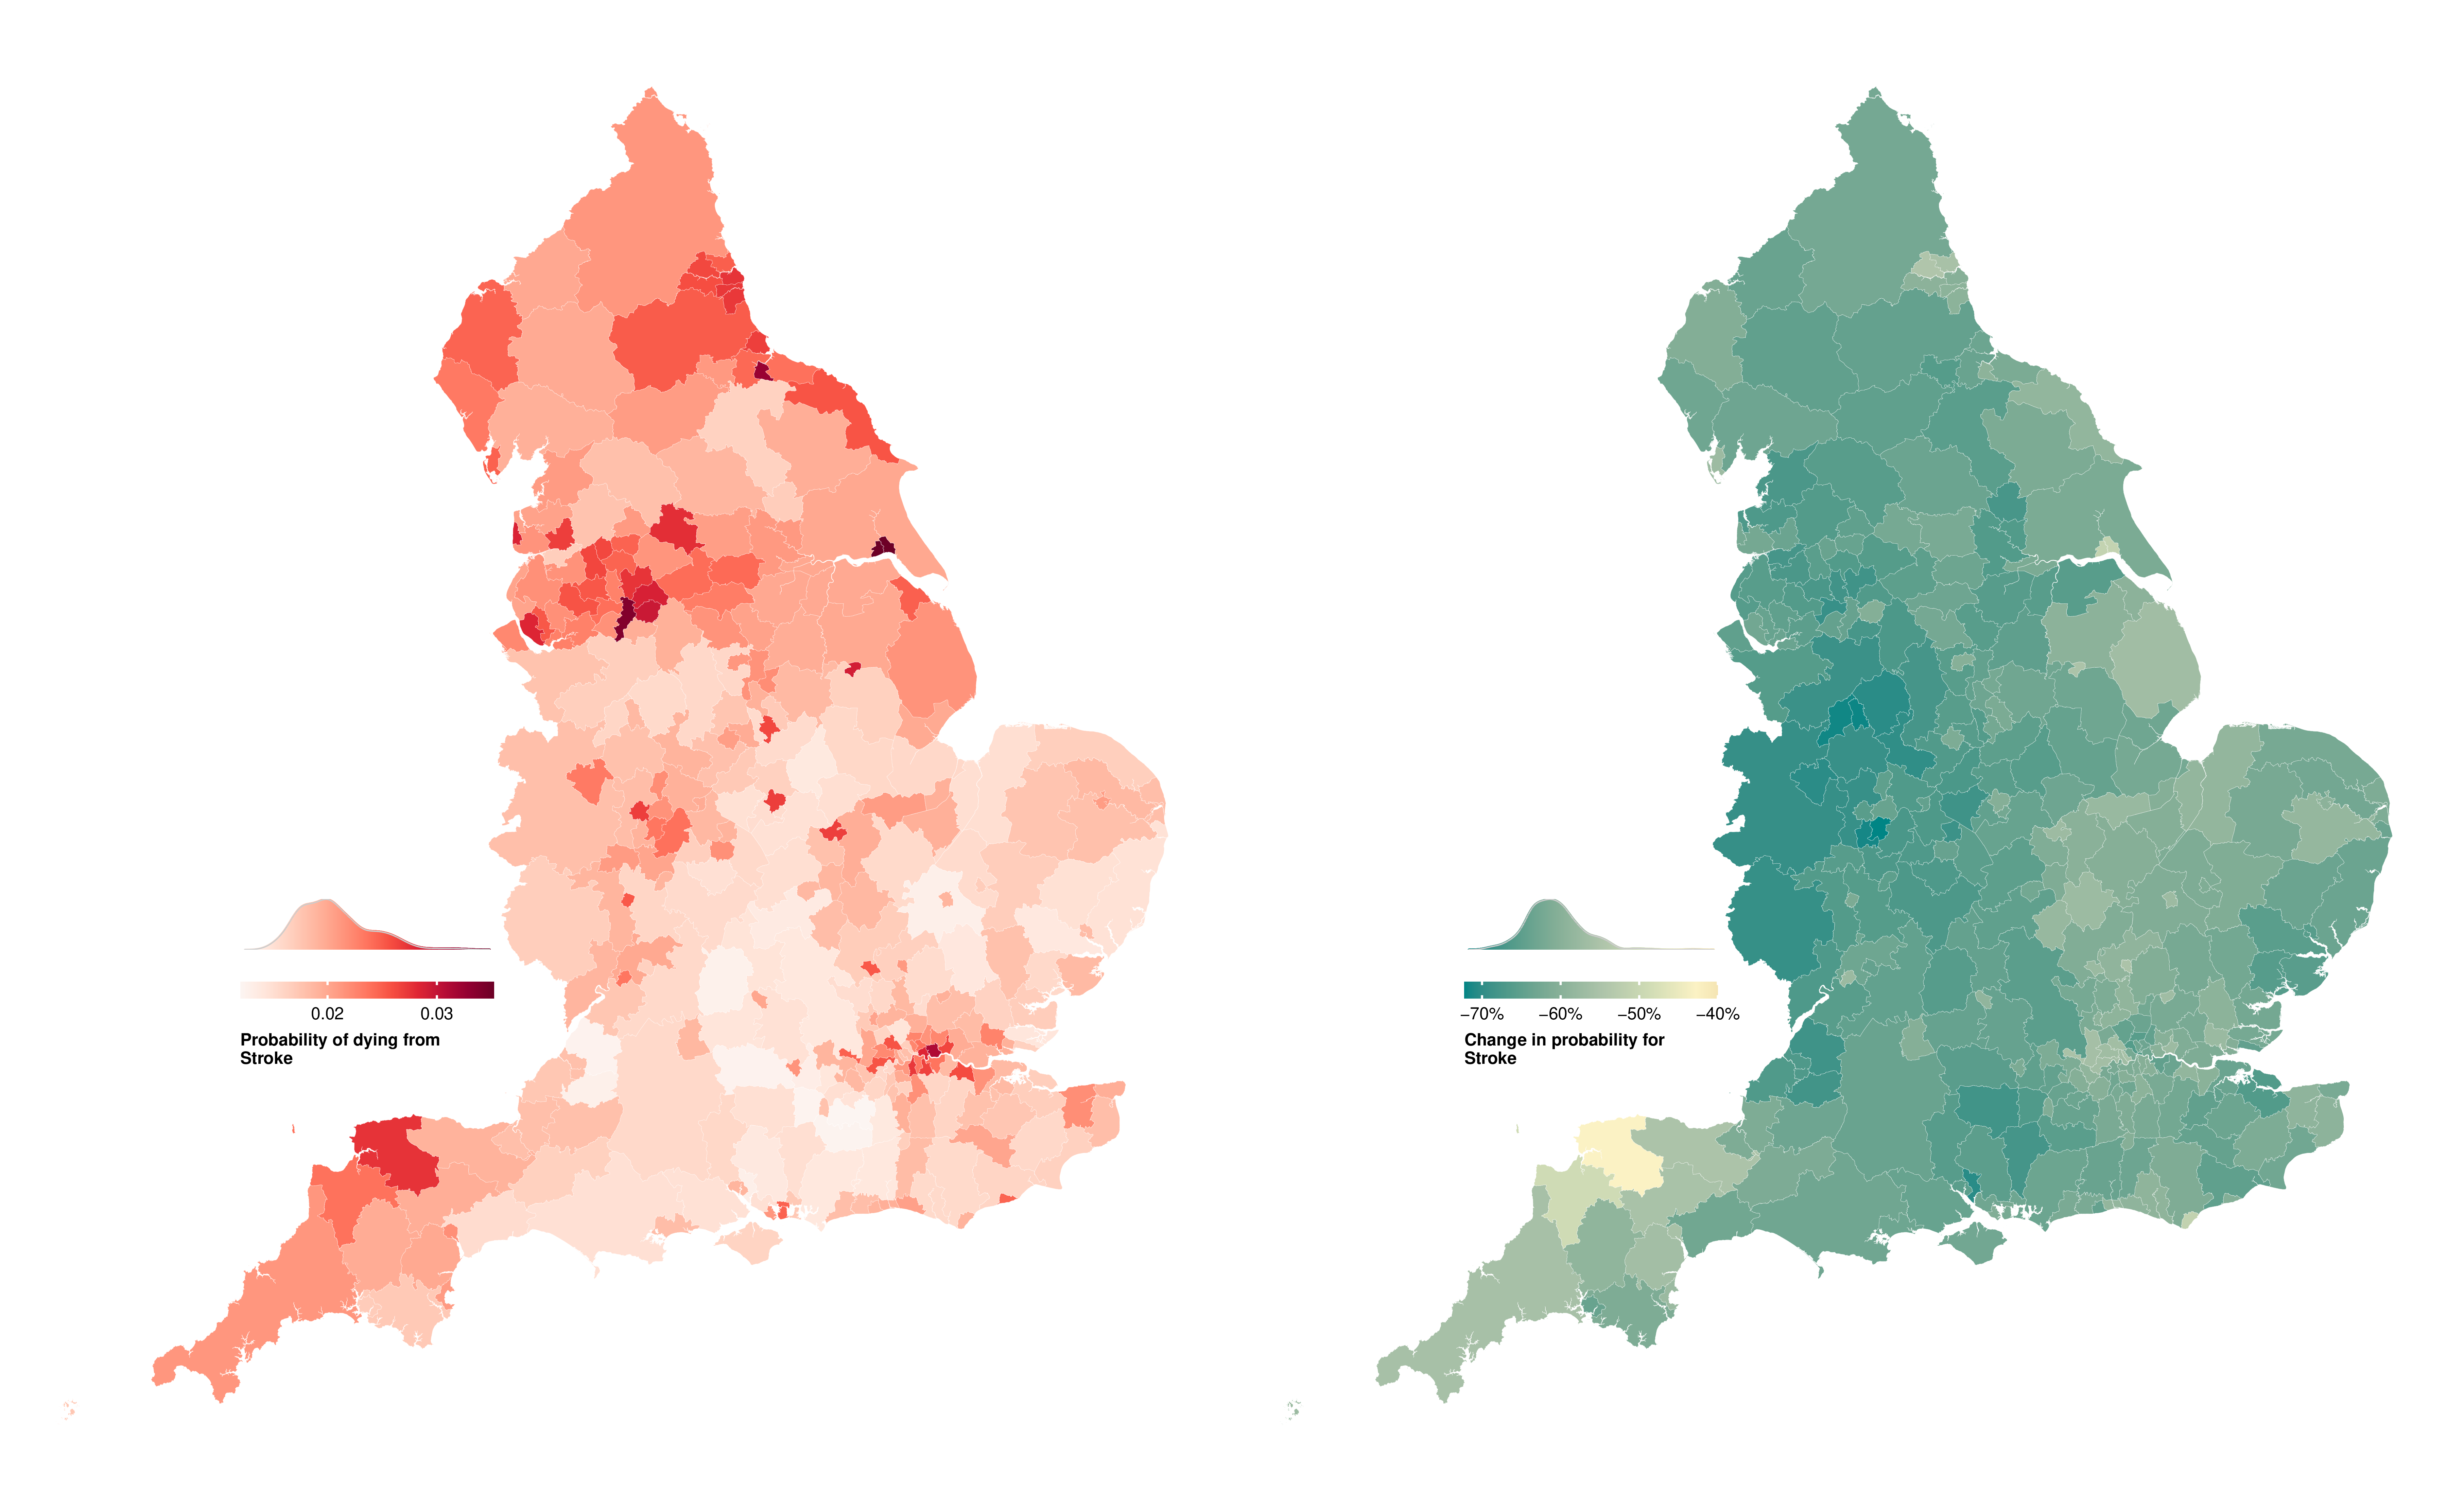
(b) Men
Figure E.2: Probability of dying from a stroke between birth and 80 years of age in 314 local authority districts in England in 2019 and change from 2002 to 2019.
(a) Women
(b) Men
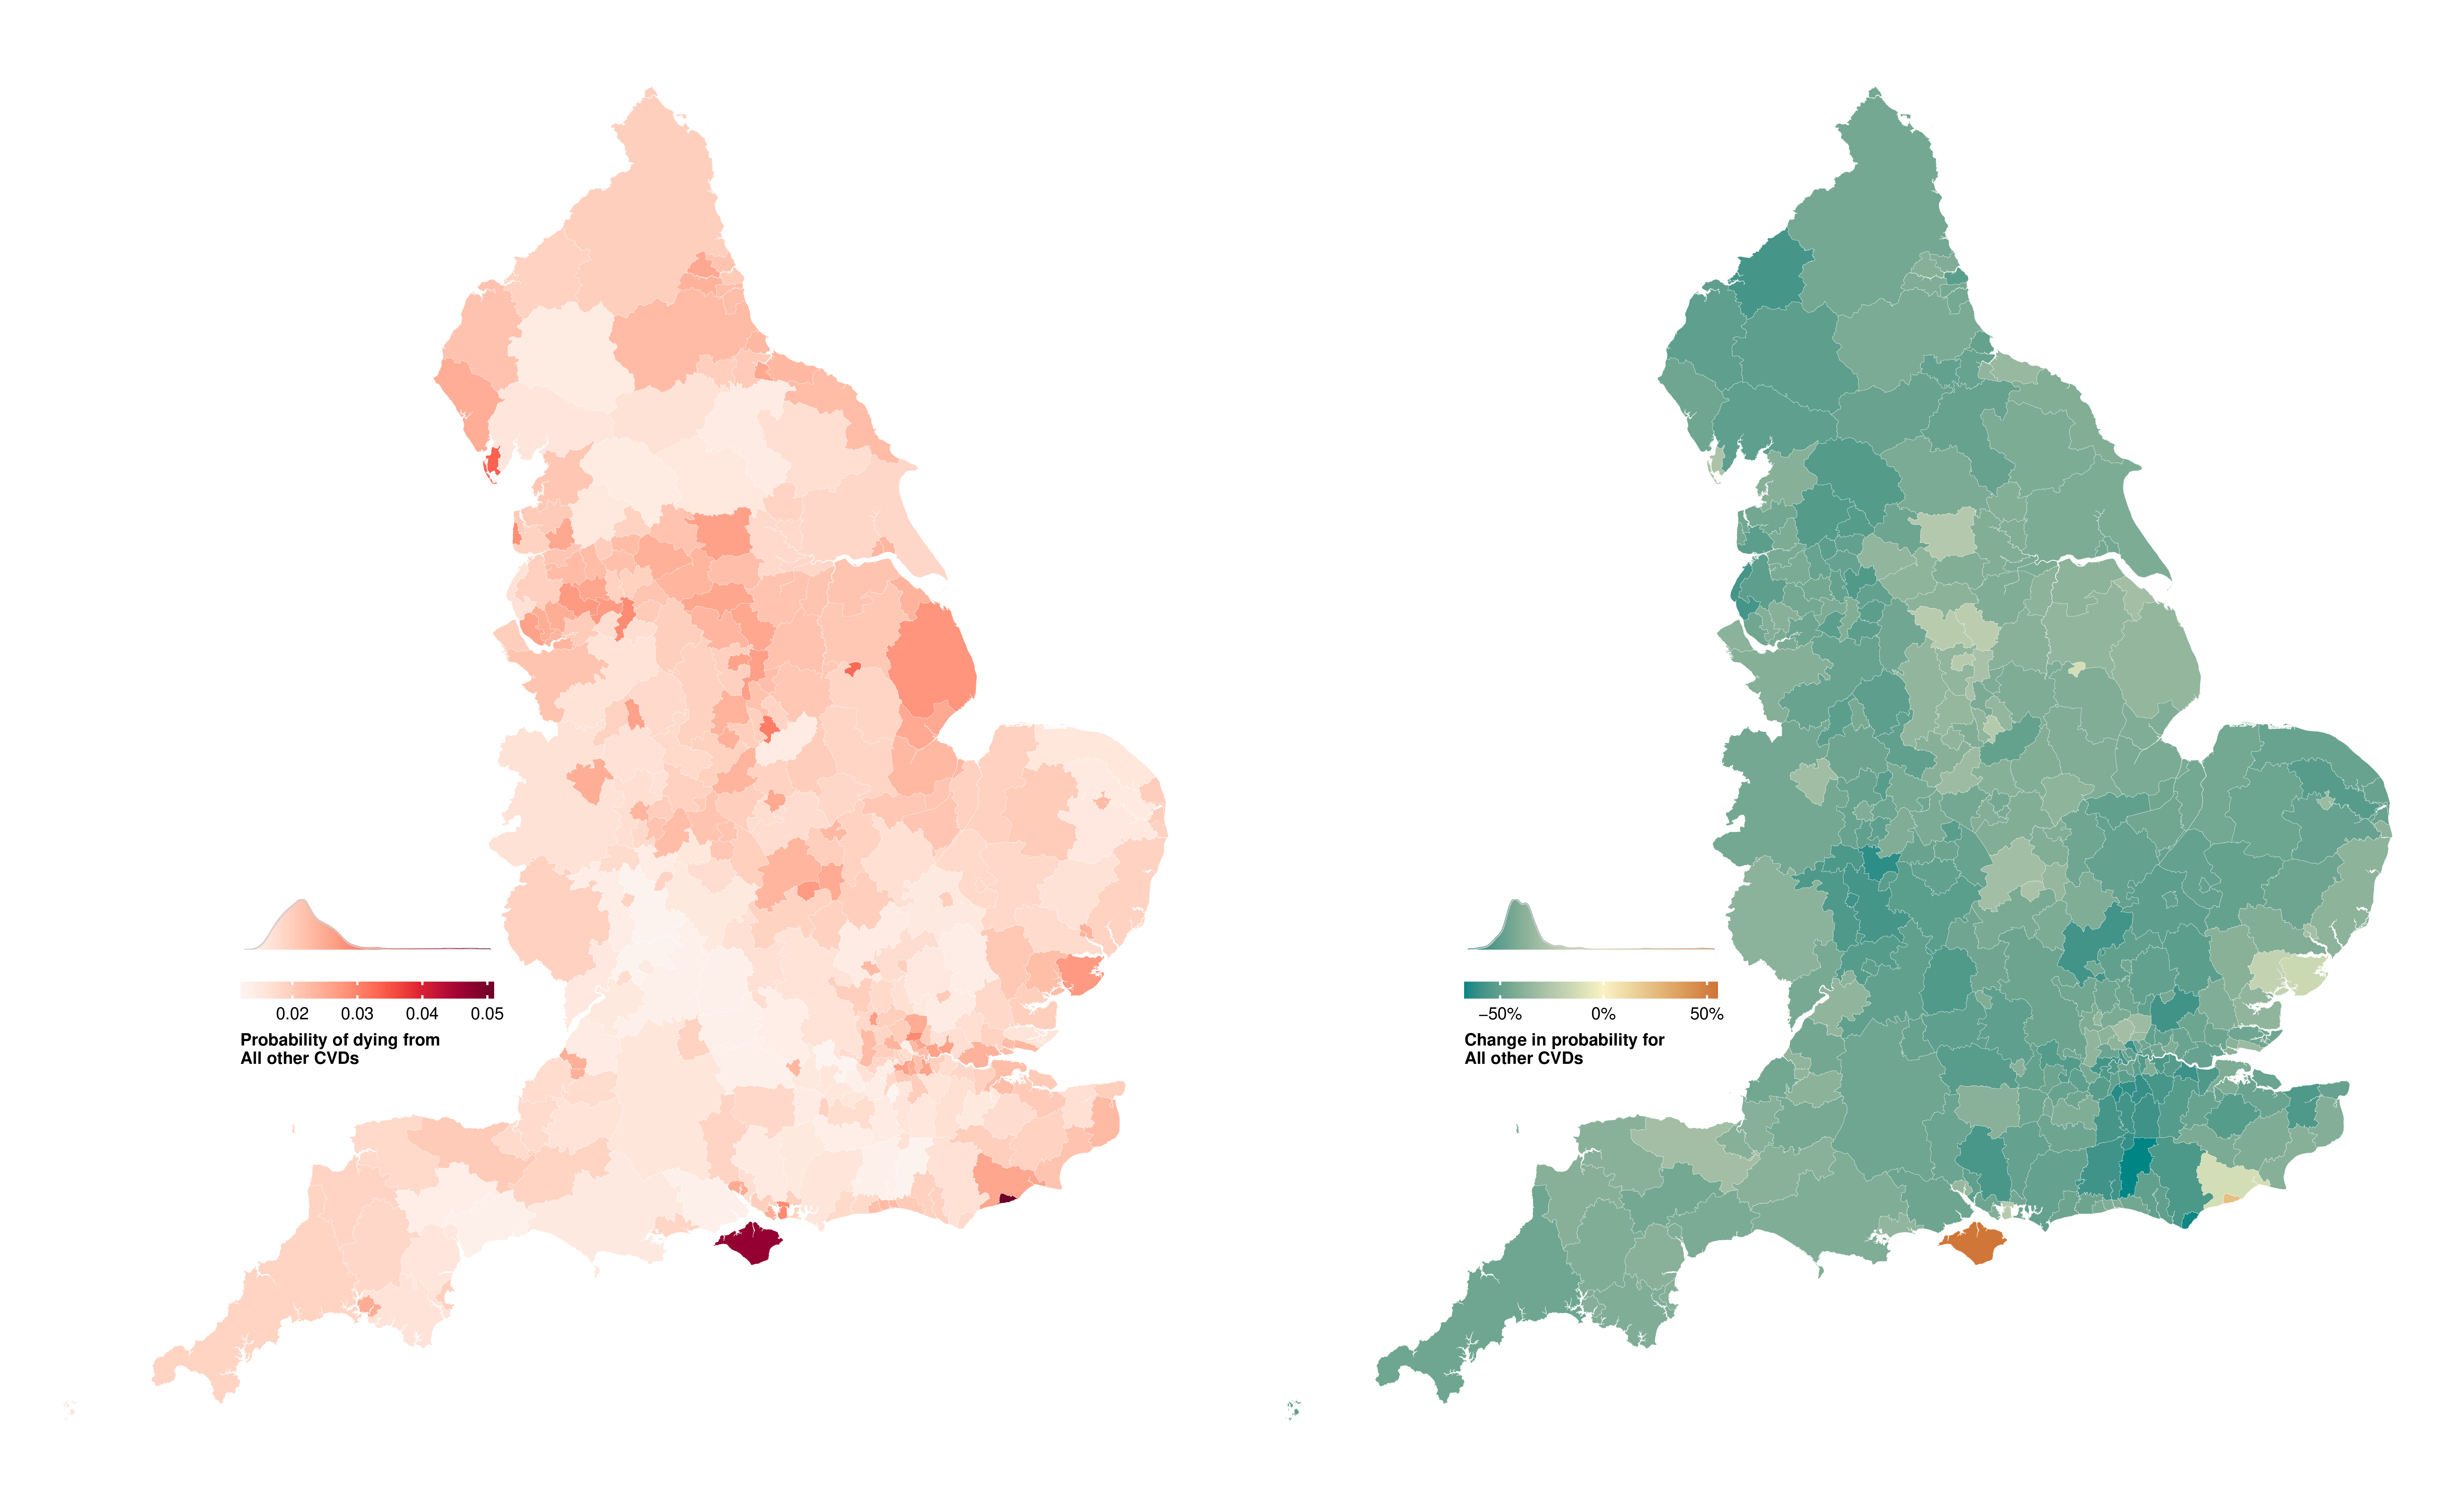
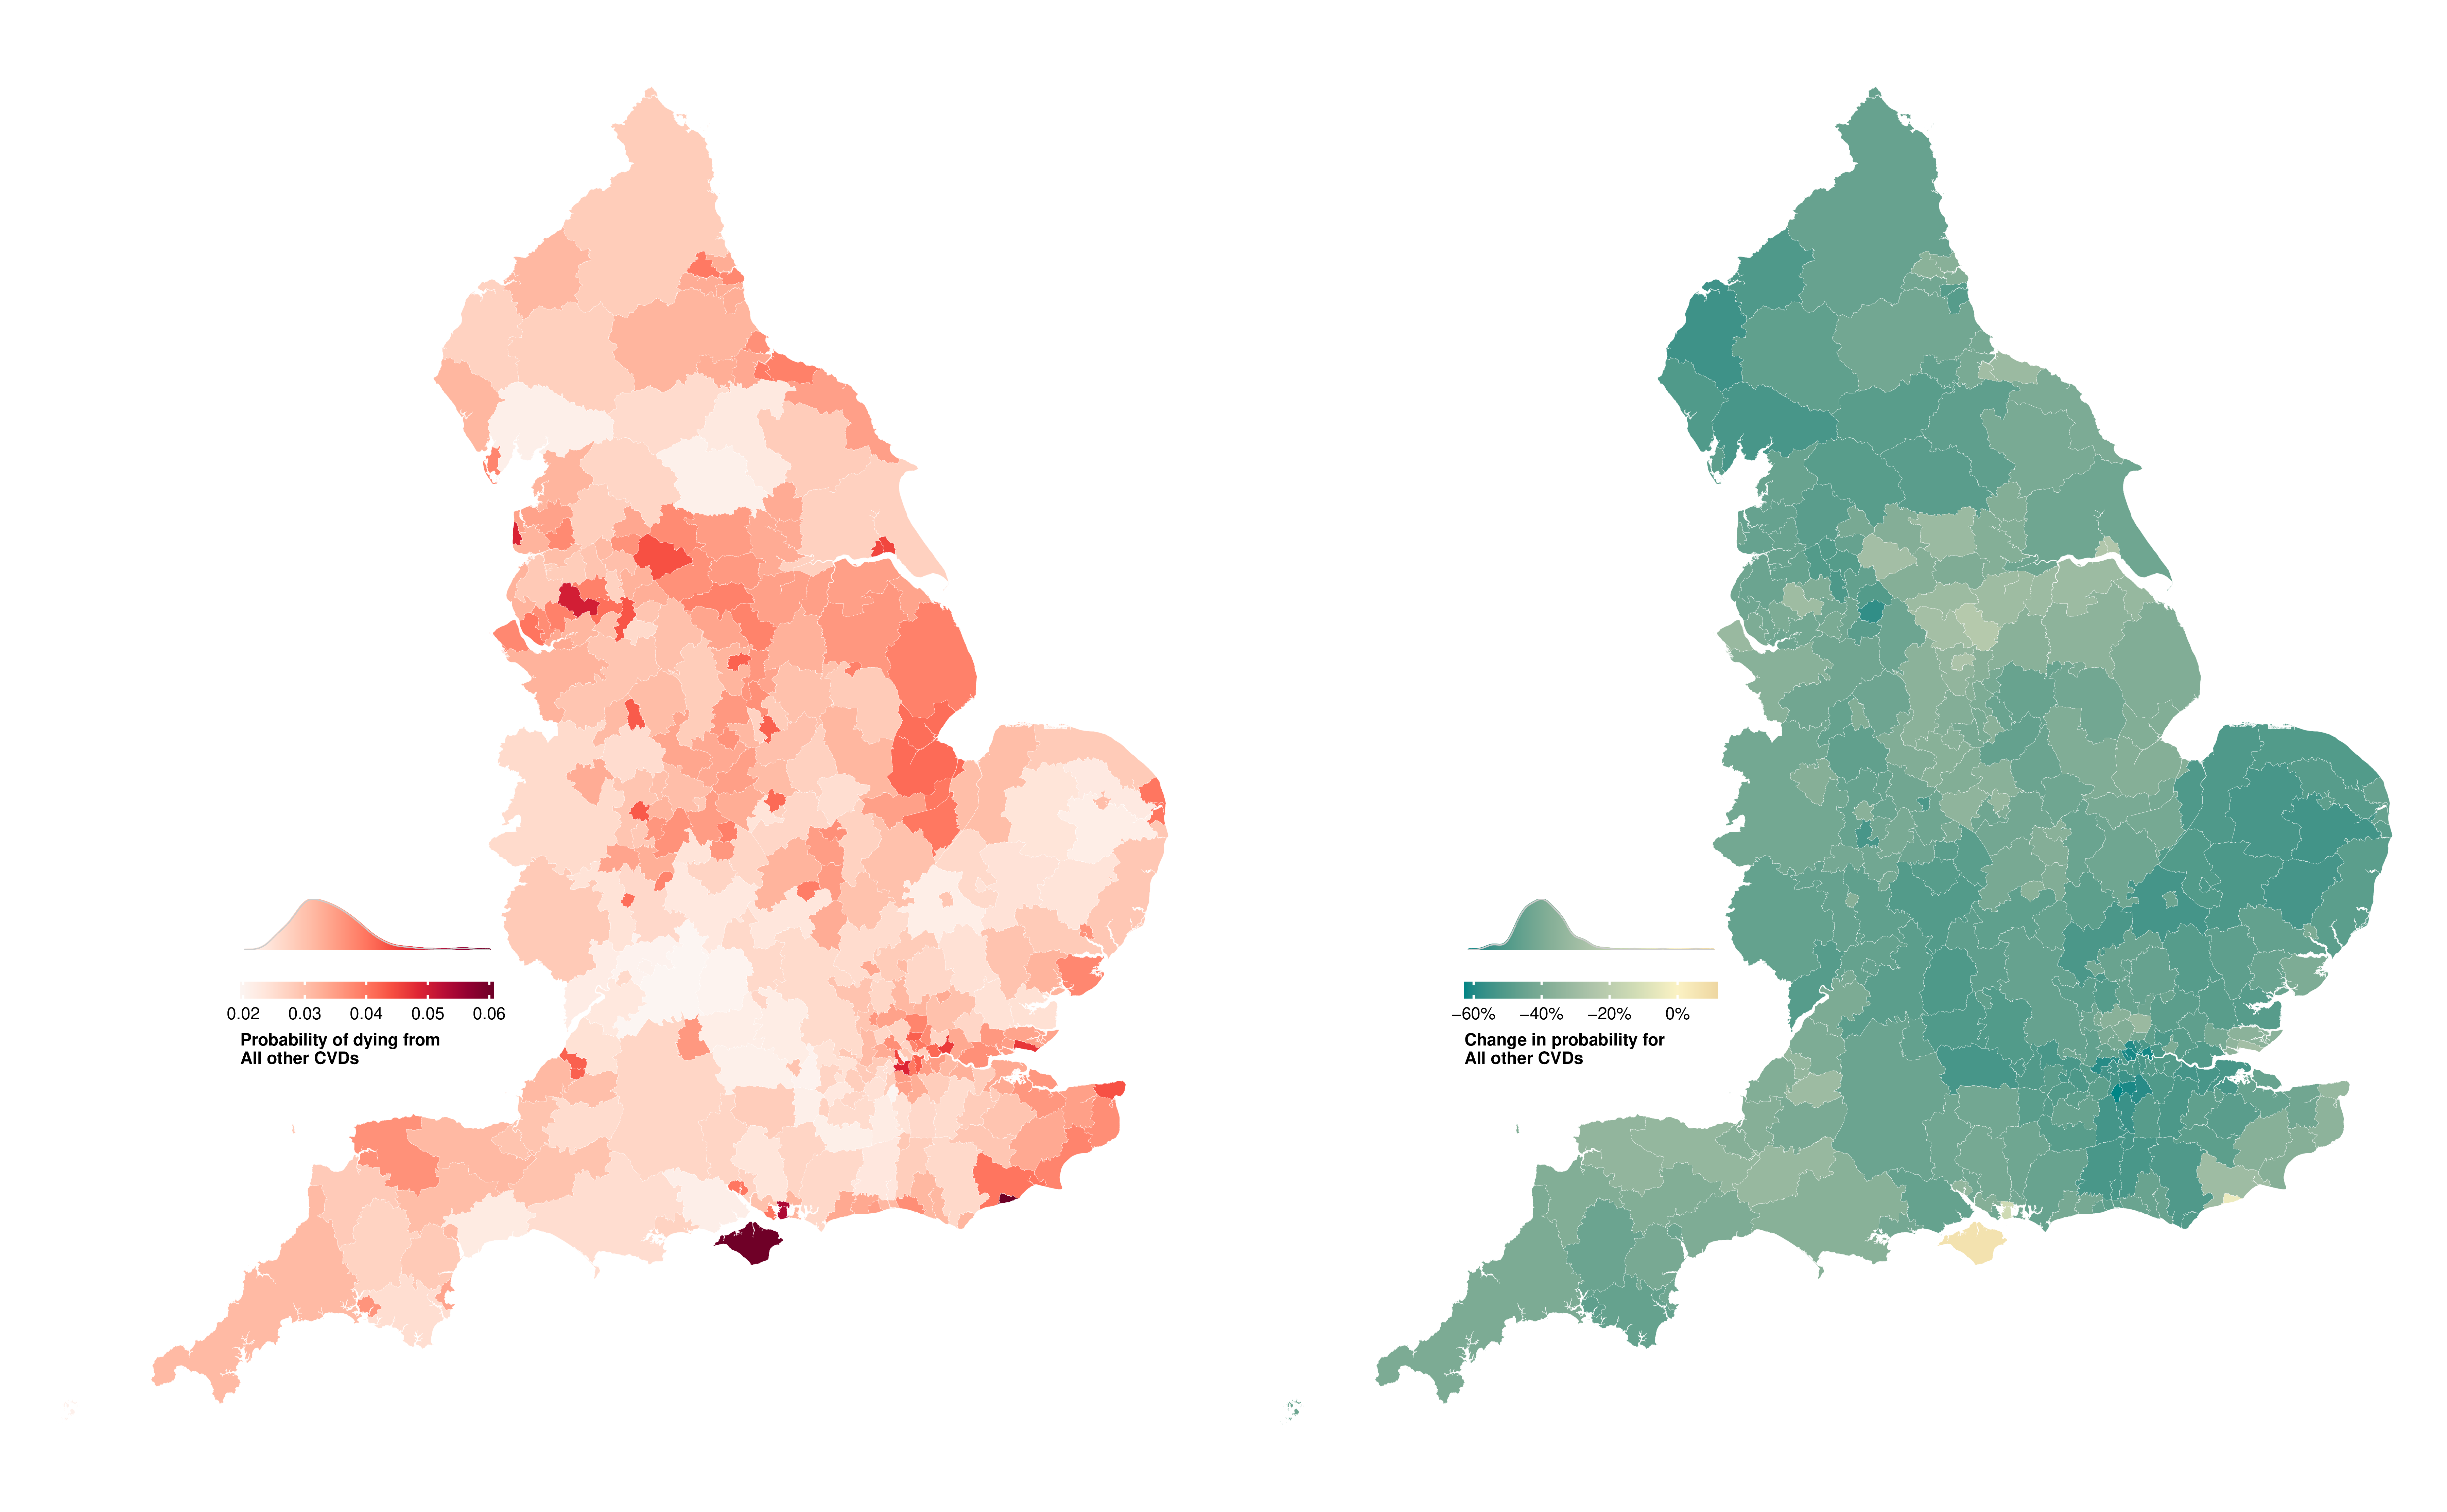
Figure E.3: Probability of dying from all other CVDs between birth and 80 years of age in 314 local authority districts in England in 2019 and change from 2002 to 2019.
(a) Women
(b) Men
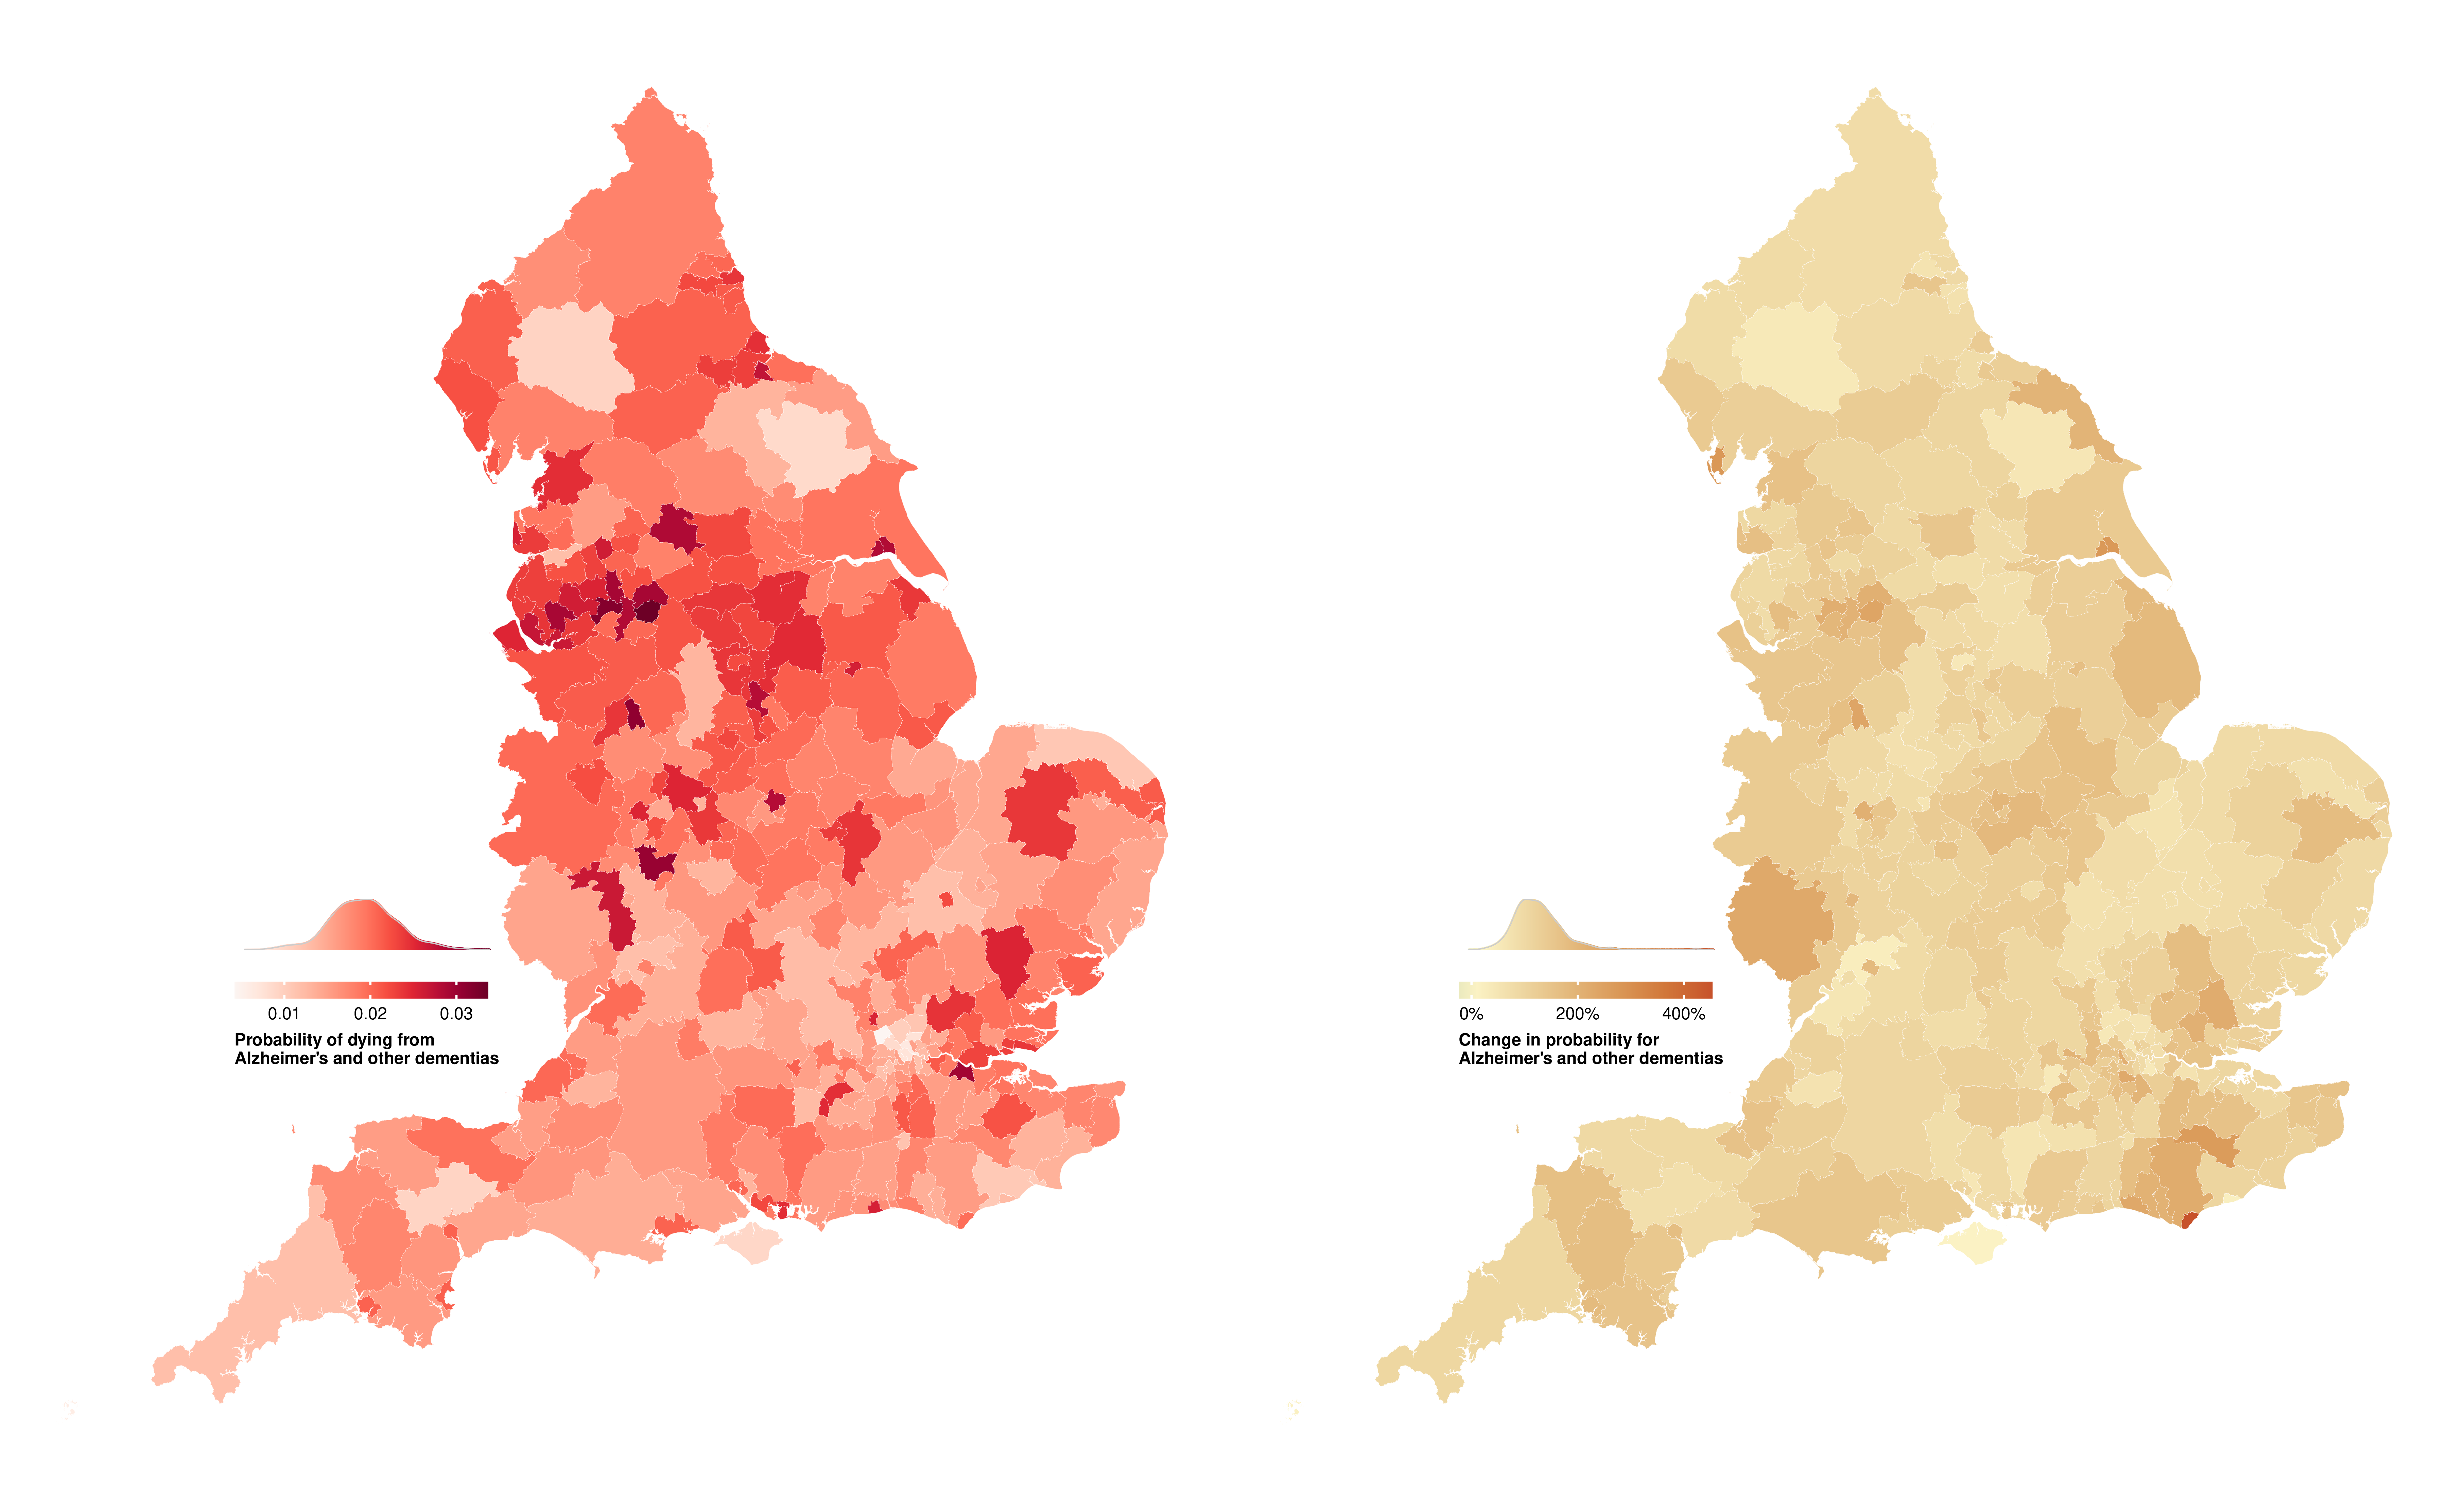
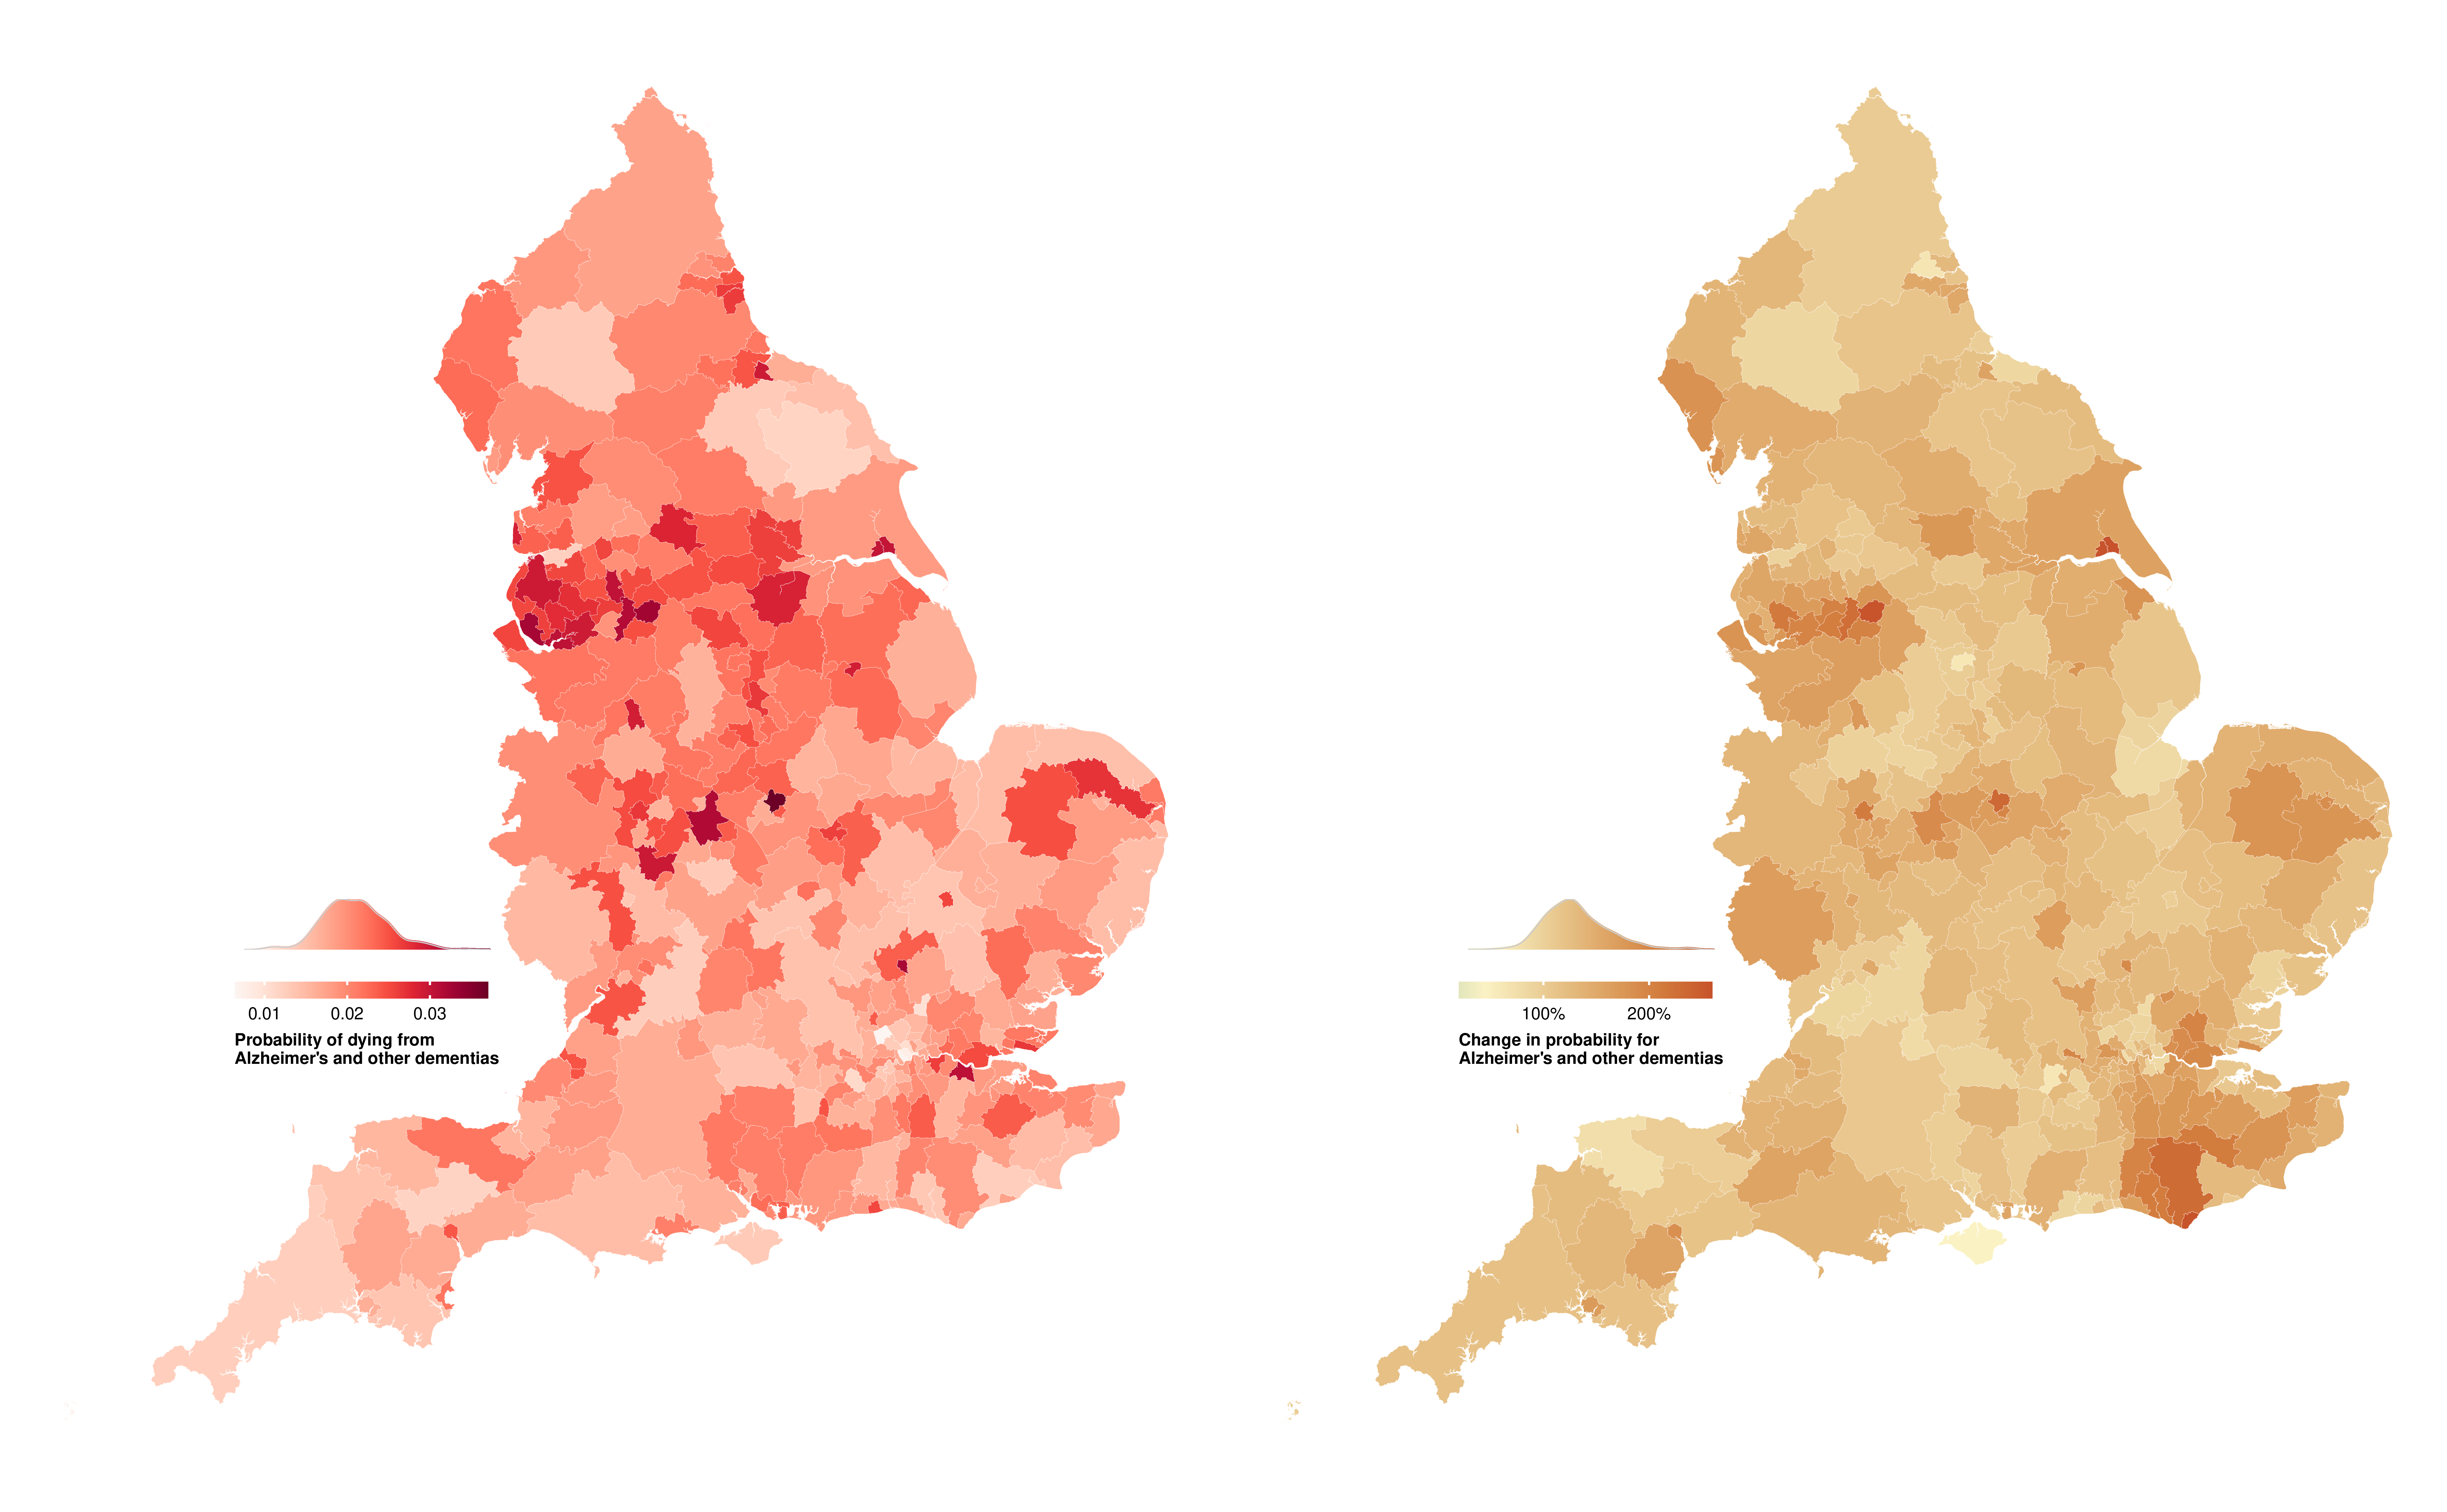
Figure E.4: Probability of dying from Alzheimer’s and other dementias between birth and 80 years of age in 314 local authority districts in England in 2019 and change from 2002 to 2019.
(a) Women
(b) Men
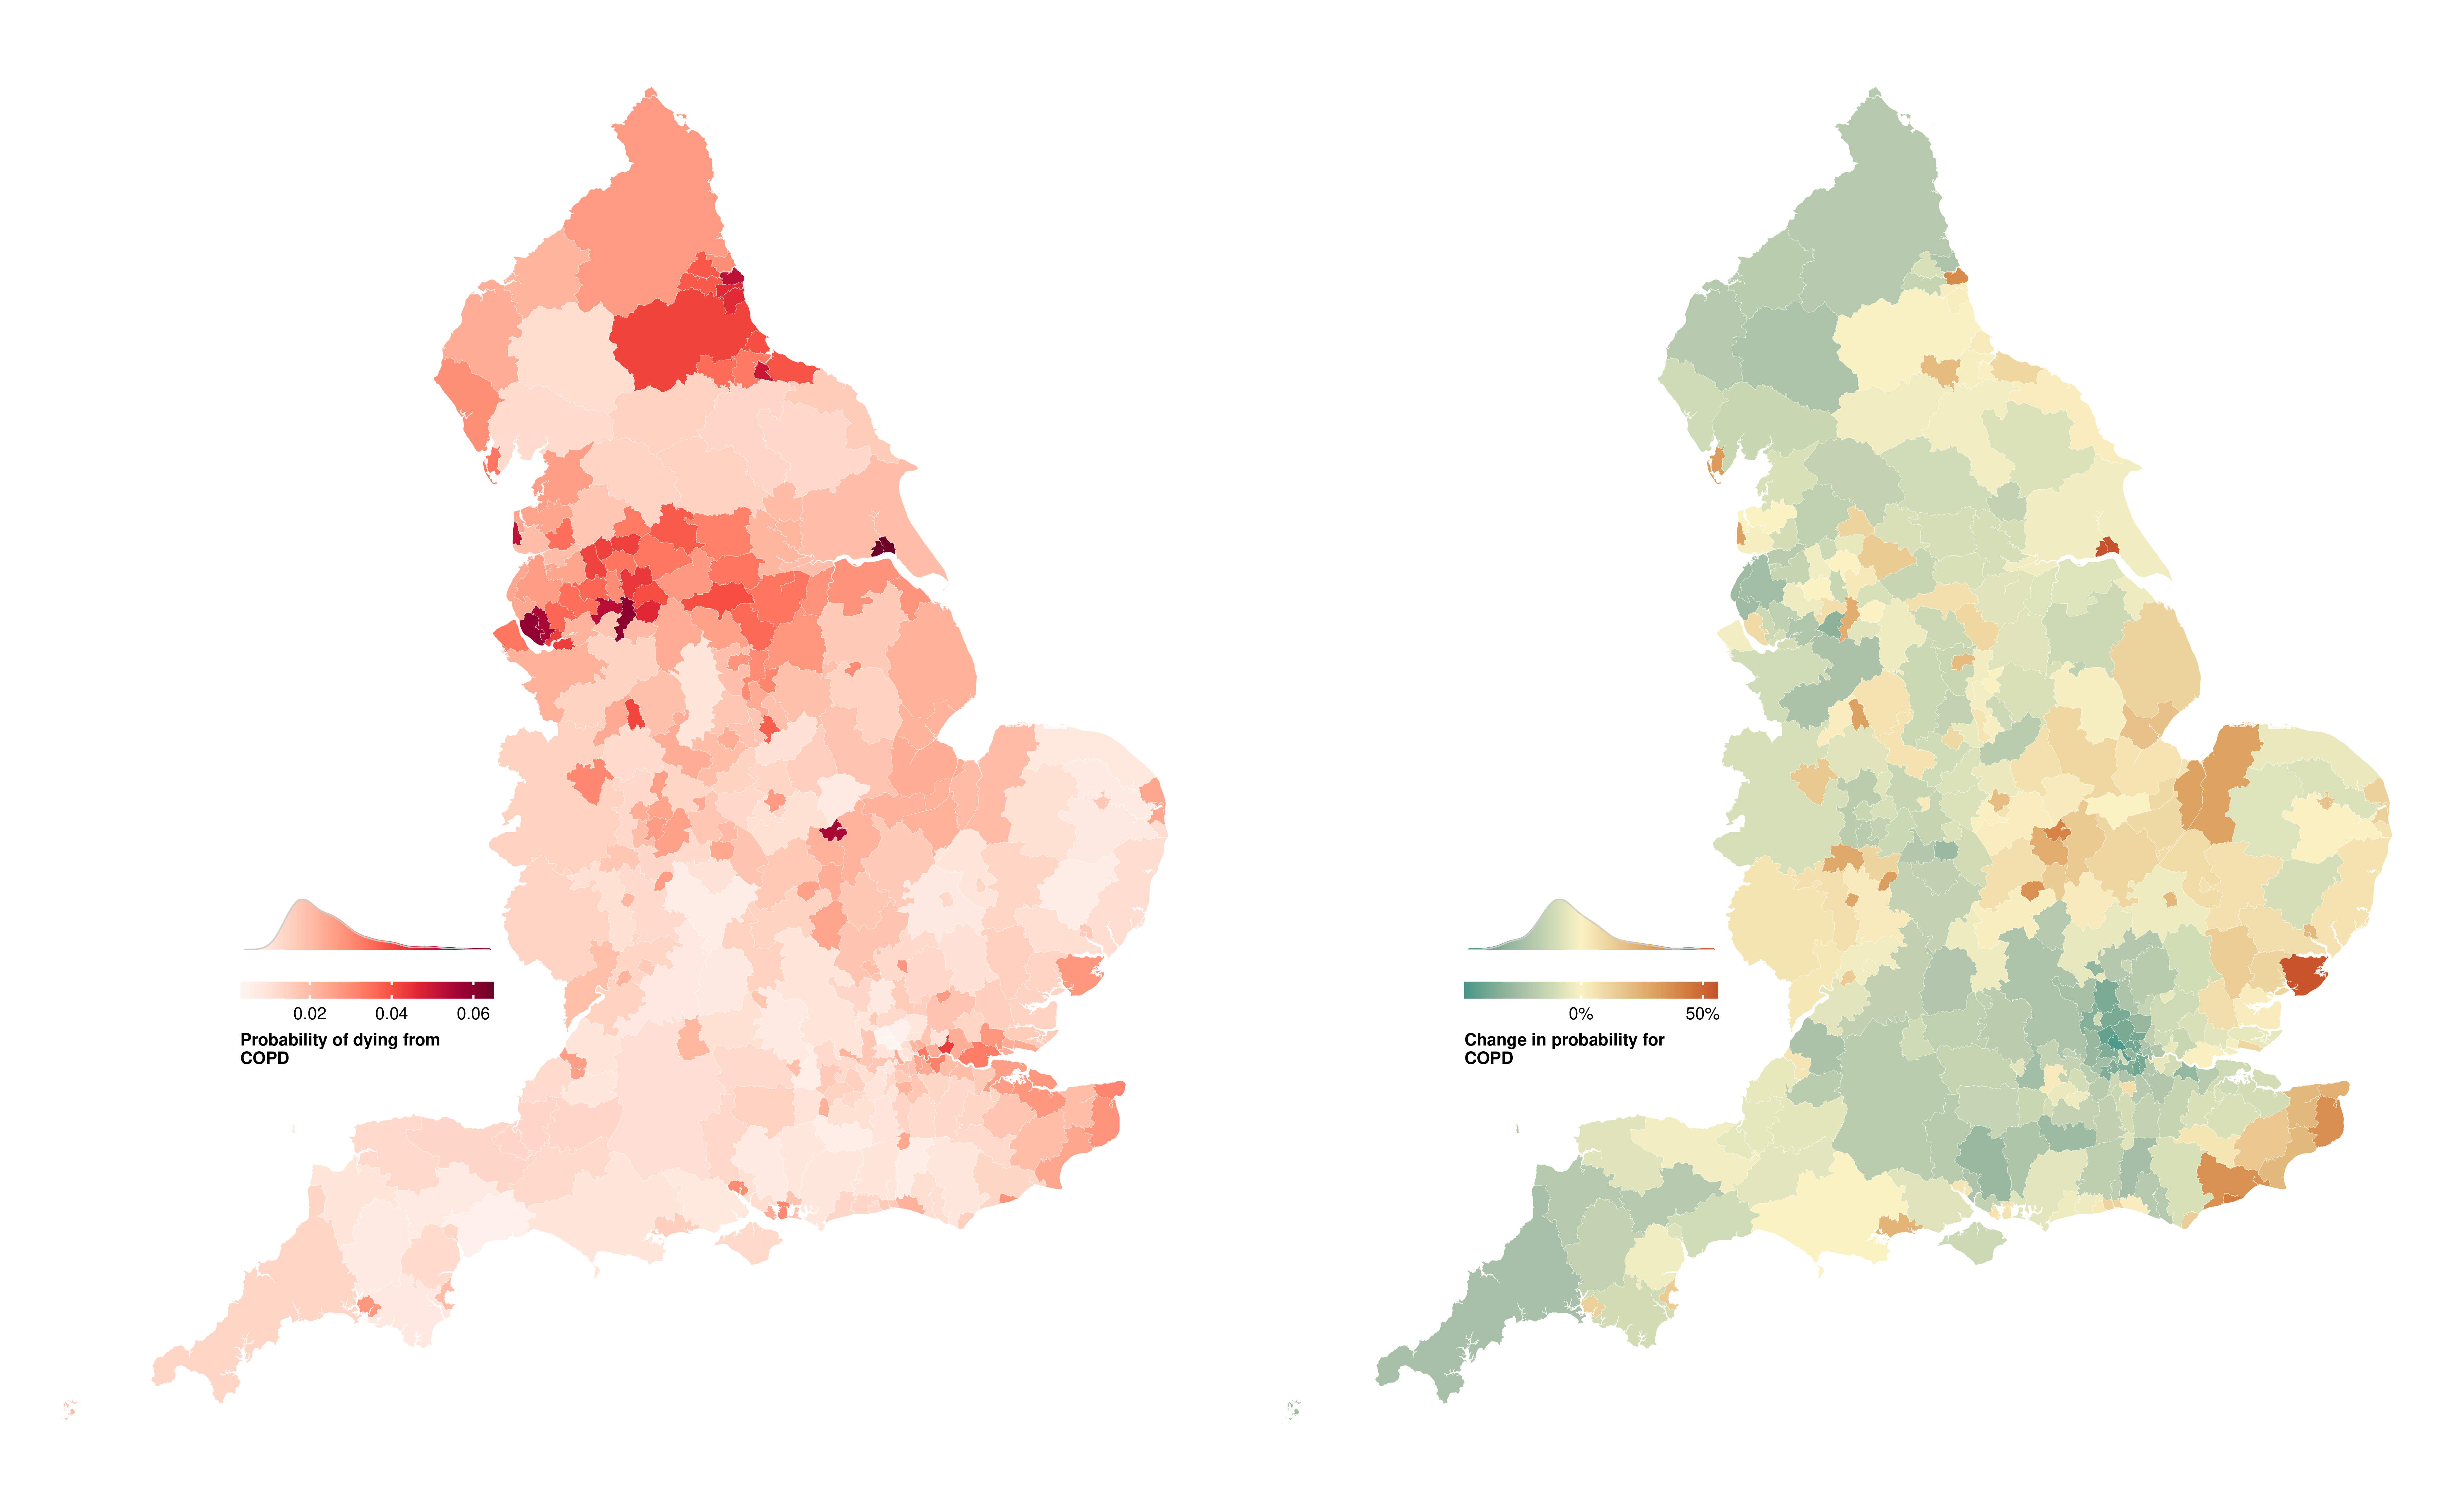
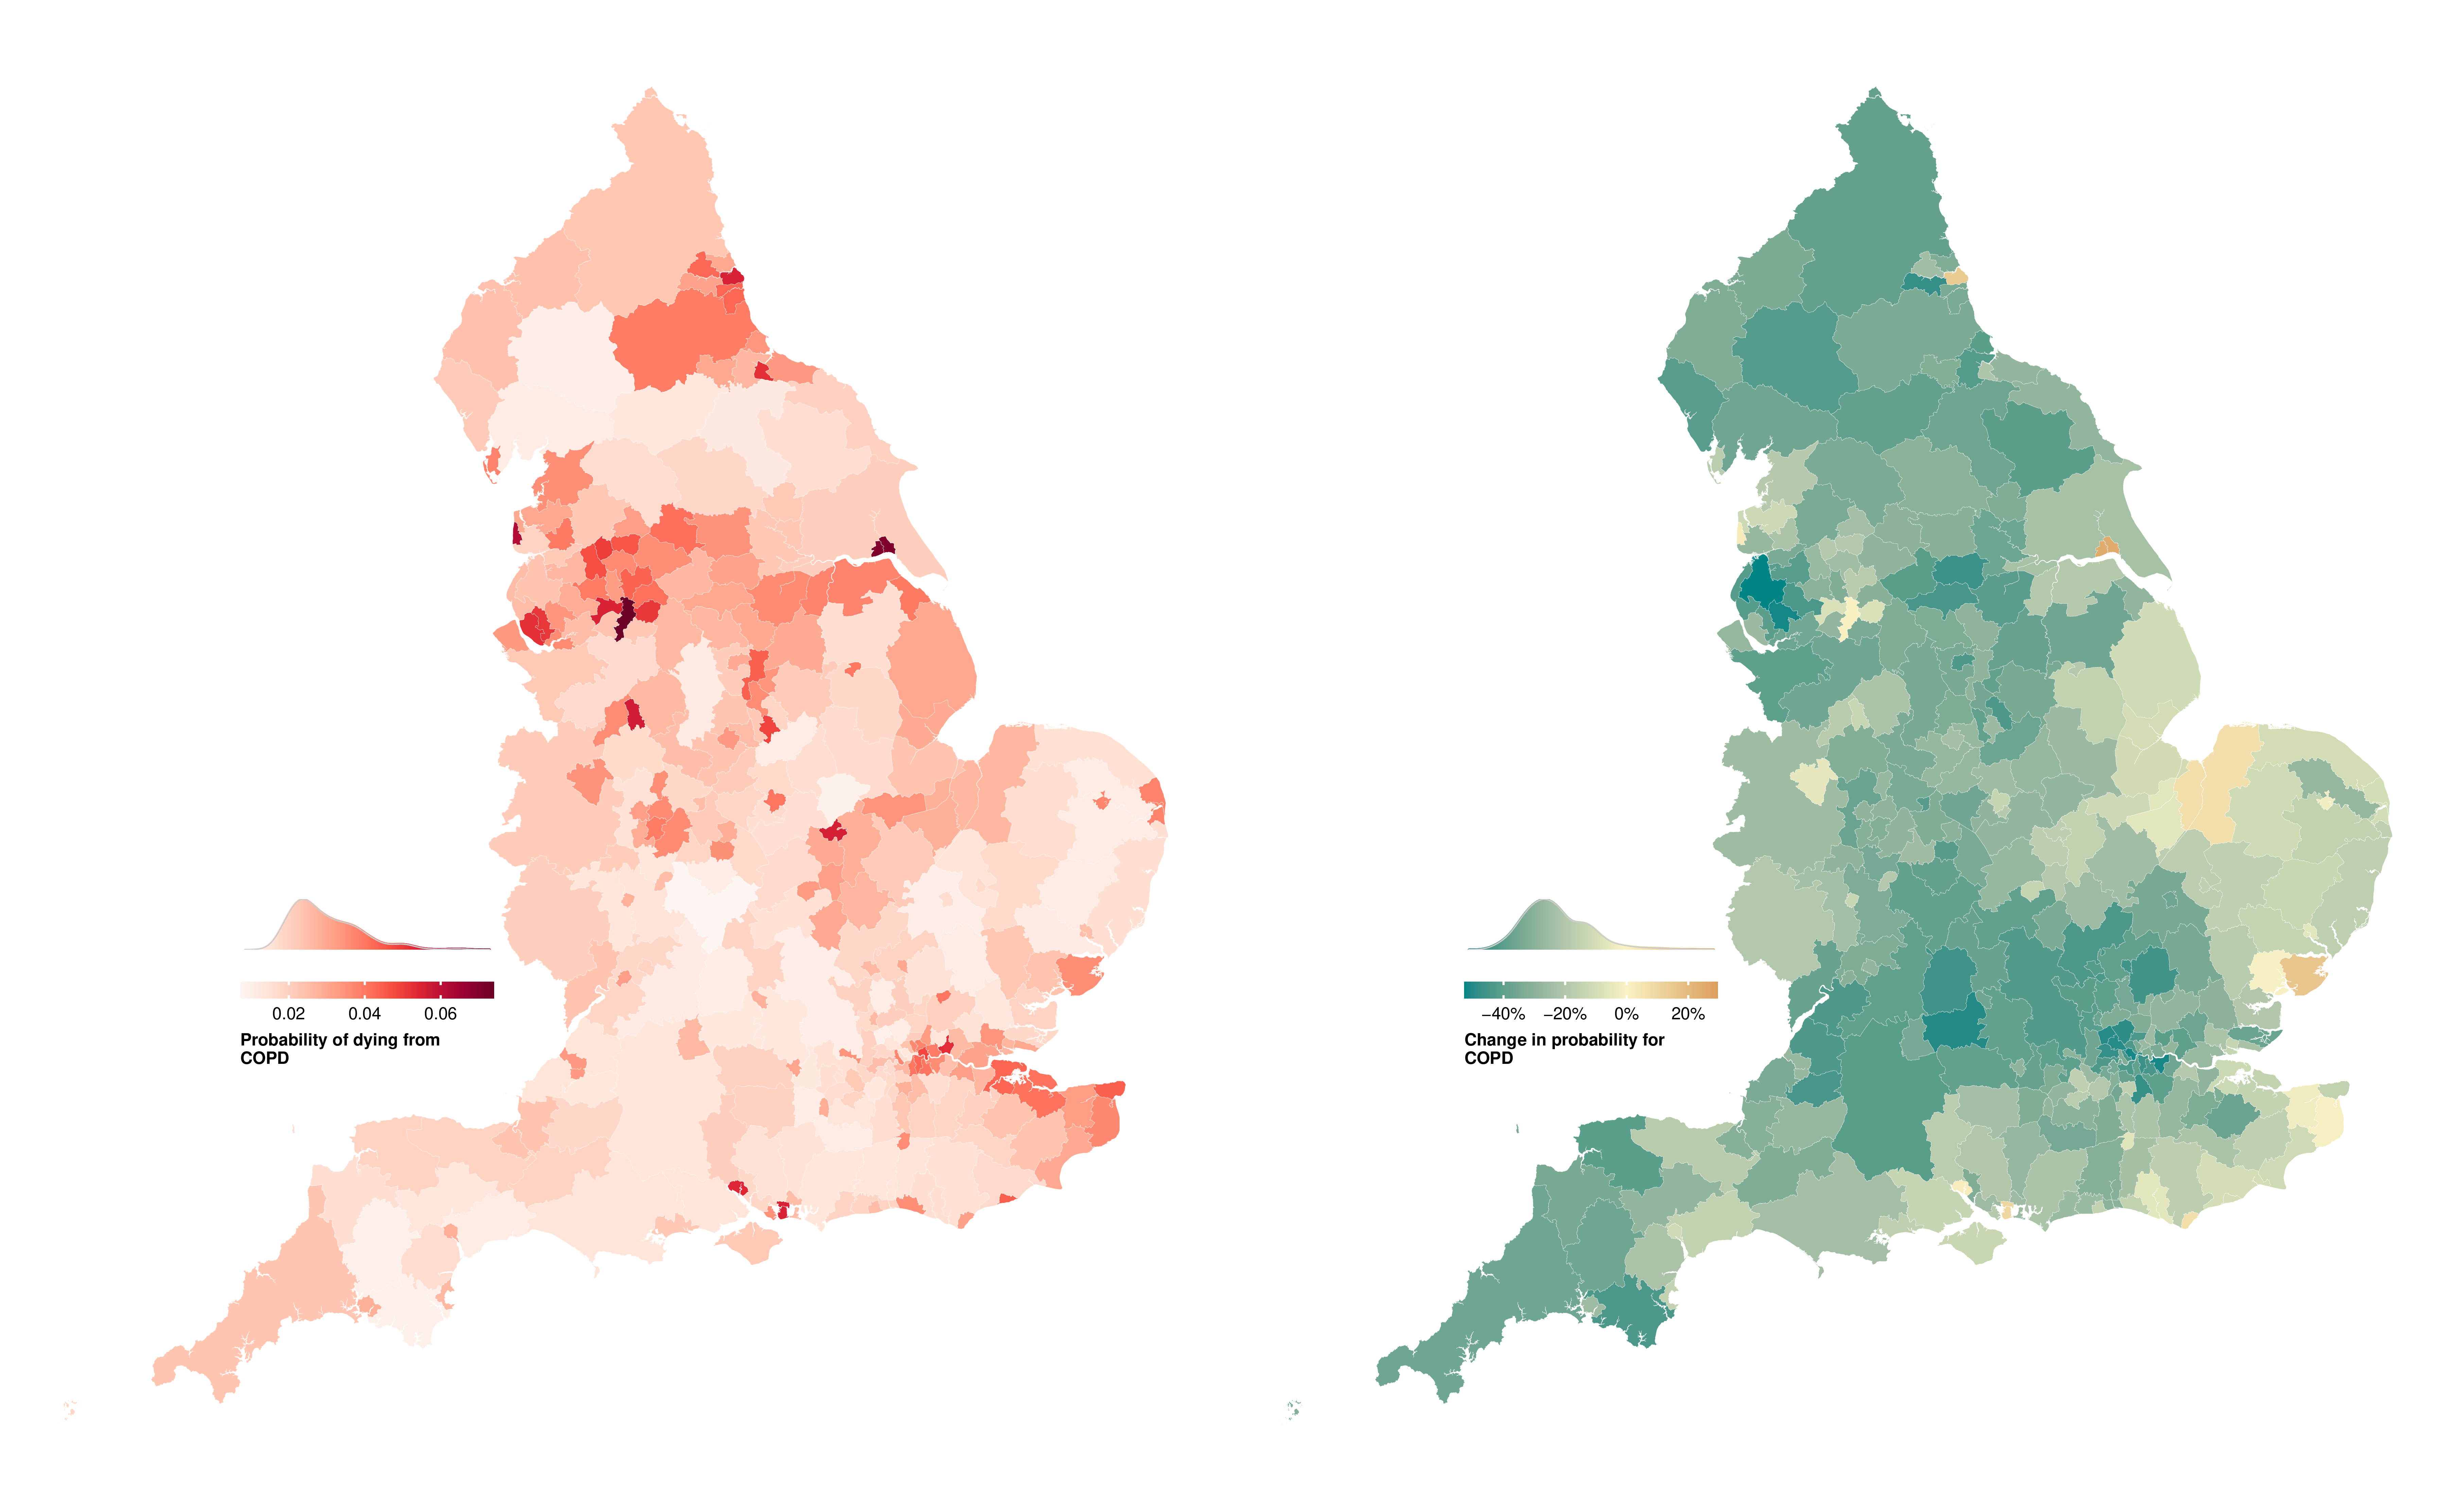
Figure E.5: Probability of dying from COPD between birth and 80 years of age in 314 local authority districts in England in 2019 and change from 2002 to 2019.
(a) Women
(b) Men
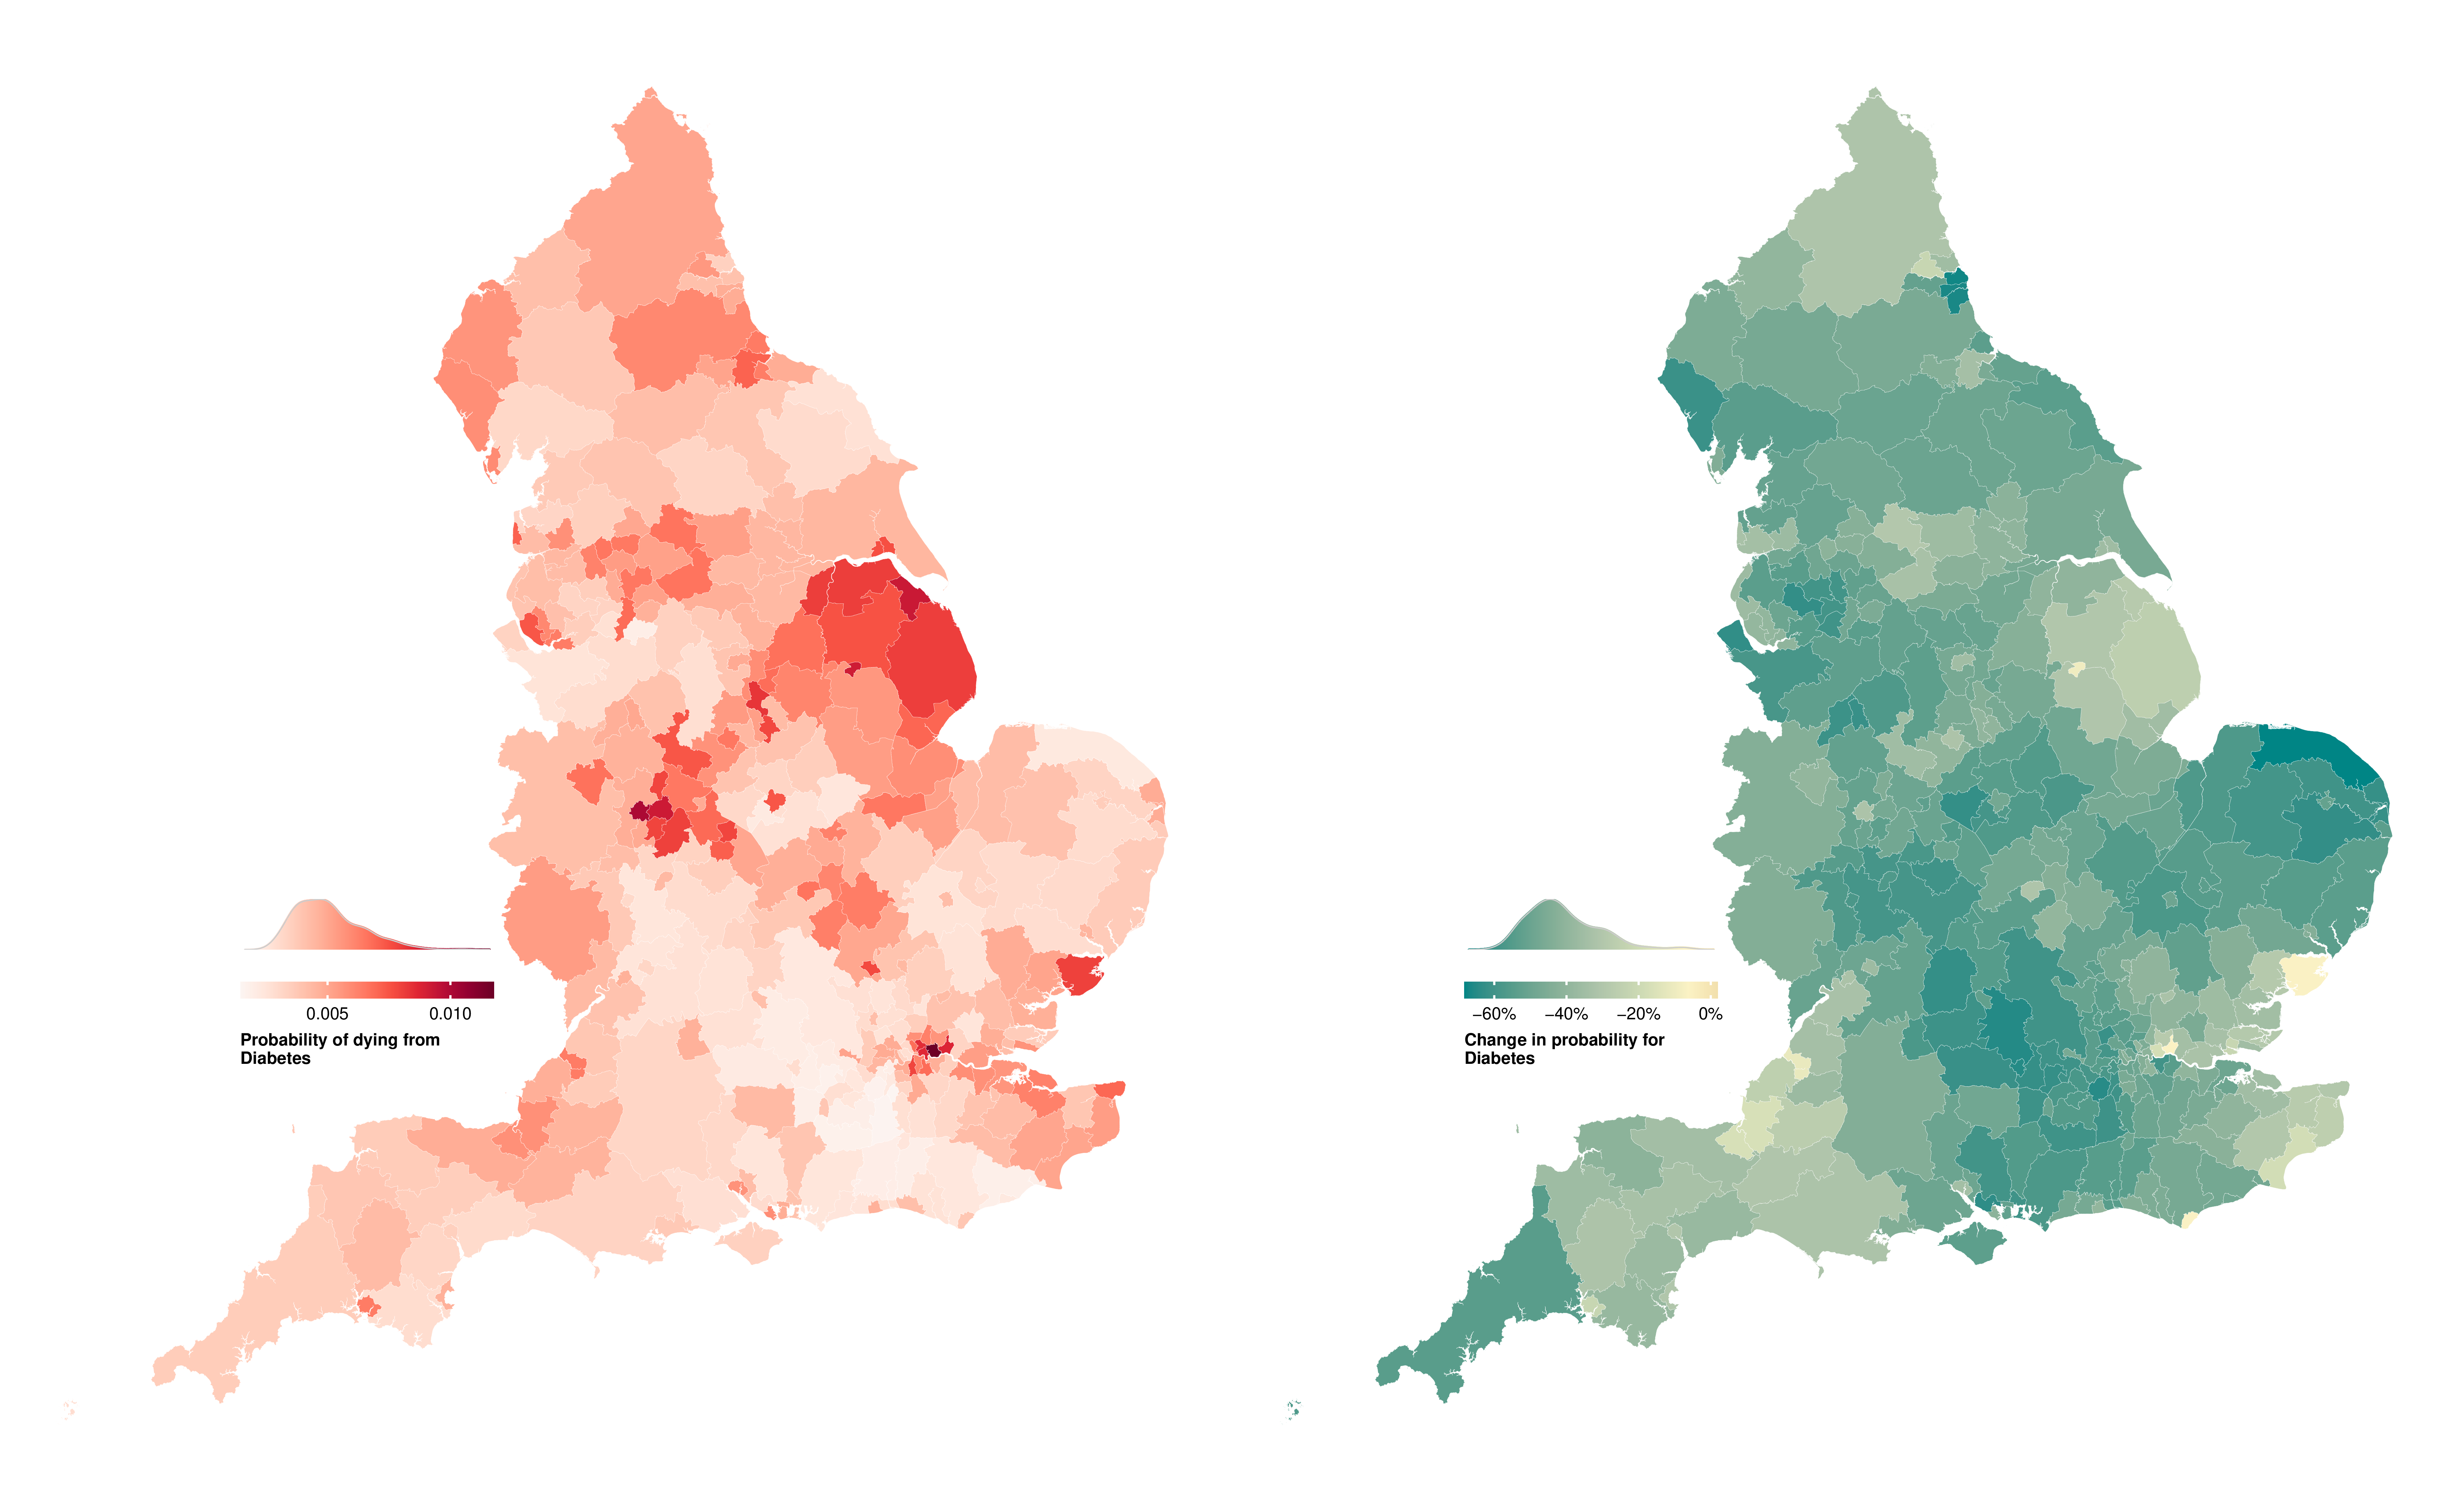
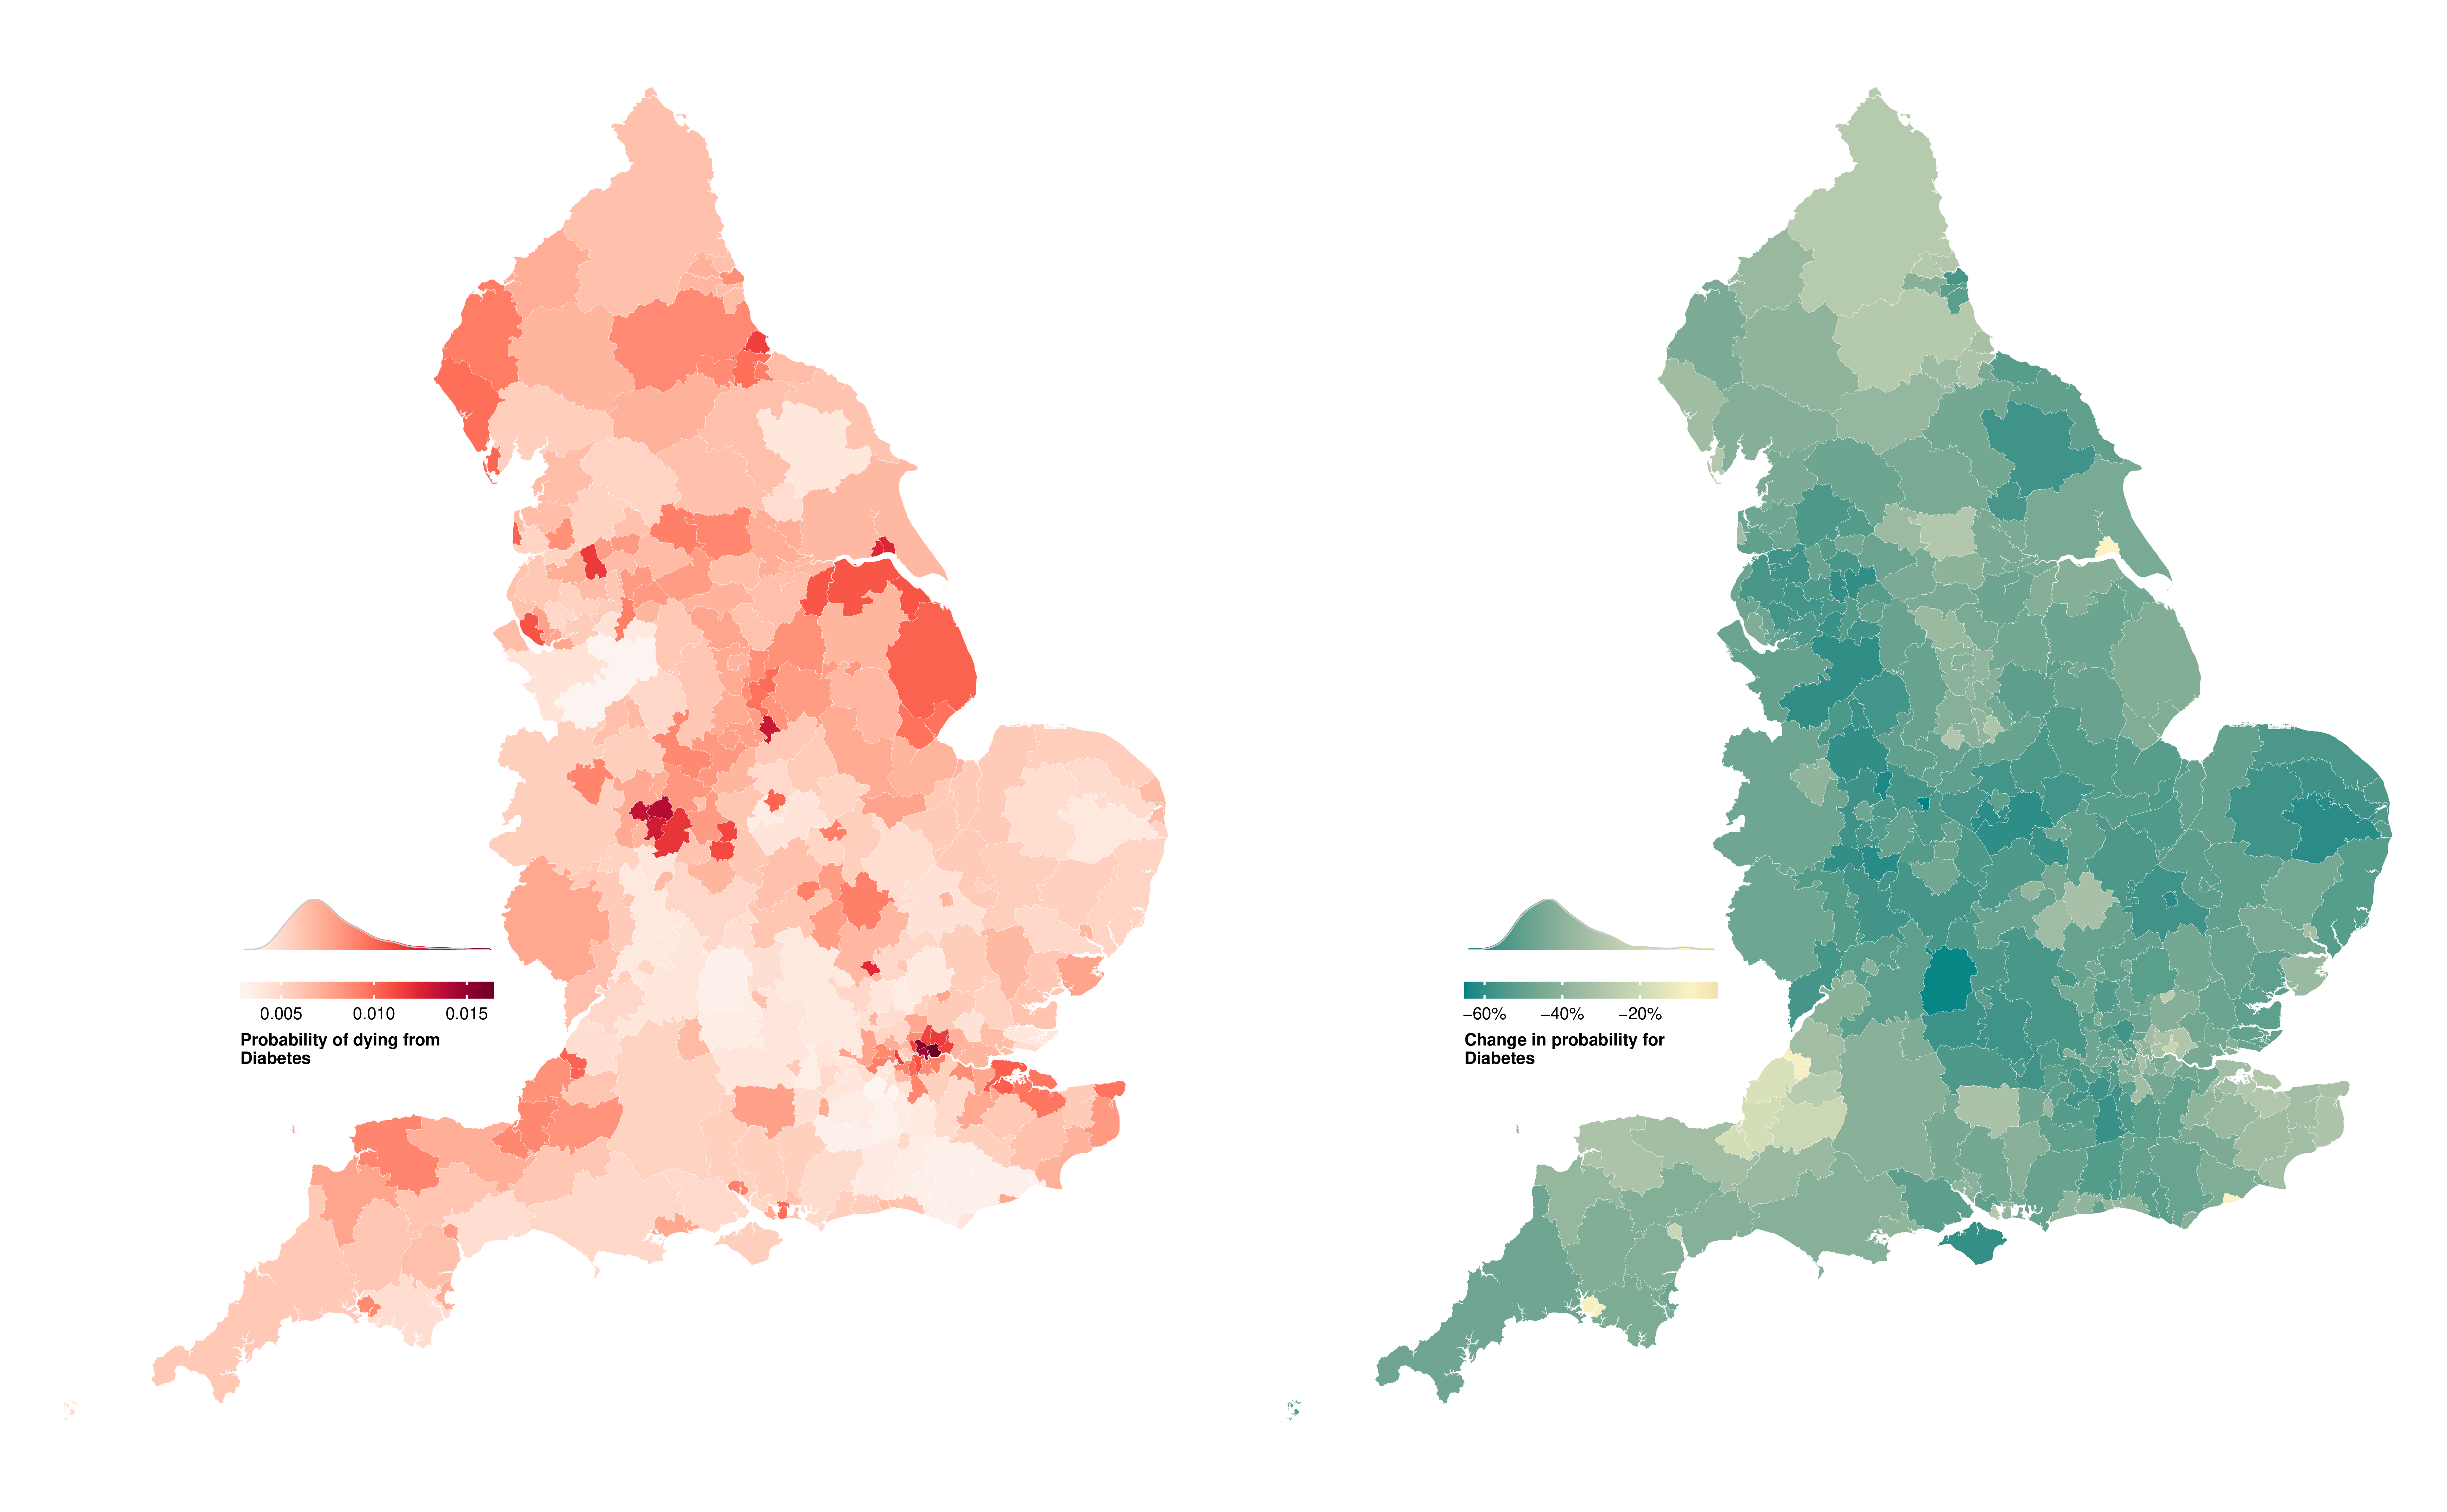
Figure E.6: Probability of dying from diabetes mellitus, nephritis and nephrosis between birth and 80 years of age in 314 local authority districts in England in 2019 and change from 2002 to 2019.
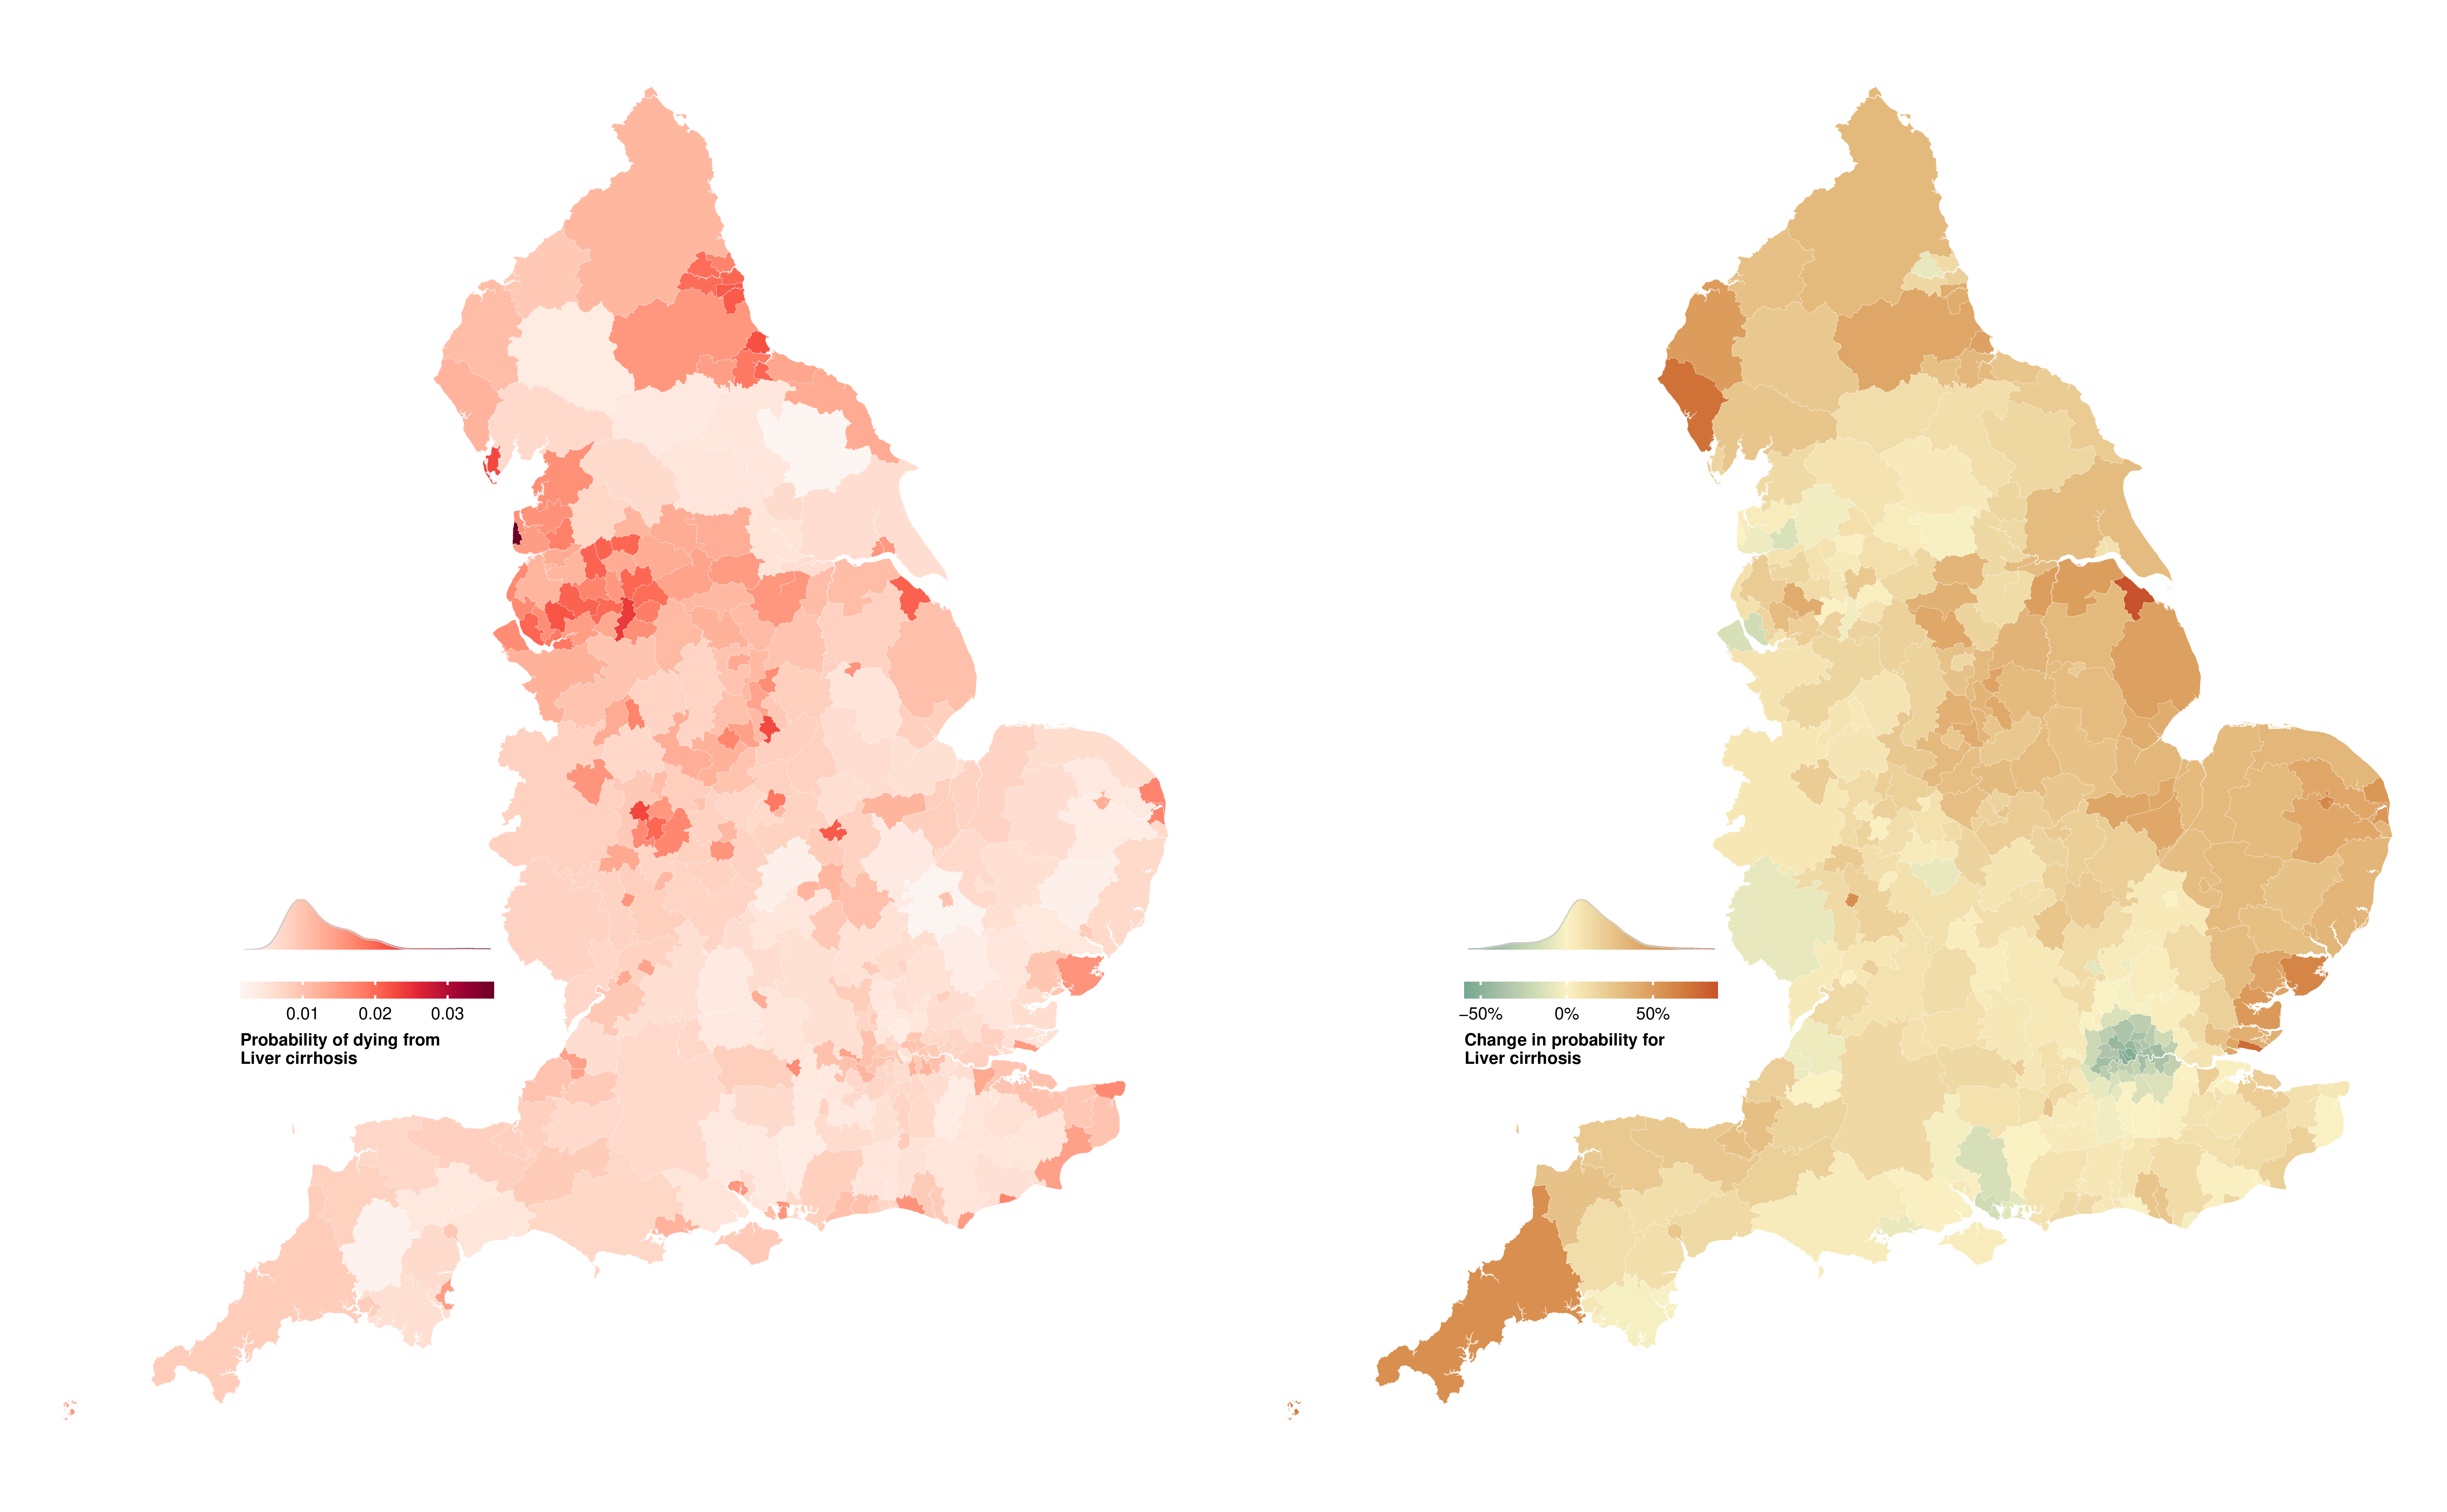
Figure E.7: Probability of dying for men from liver cirrhosis between birth and 80 years of age in 314 local authority districts in England in 2019 and change from 2002 to 2019.
(a) Women
(b) Men
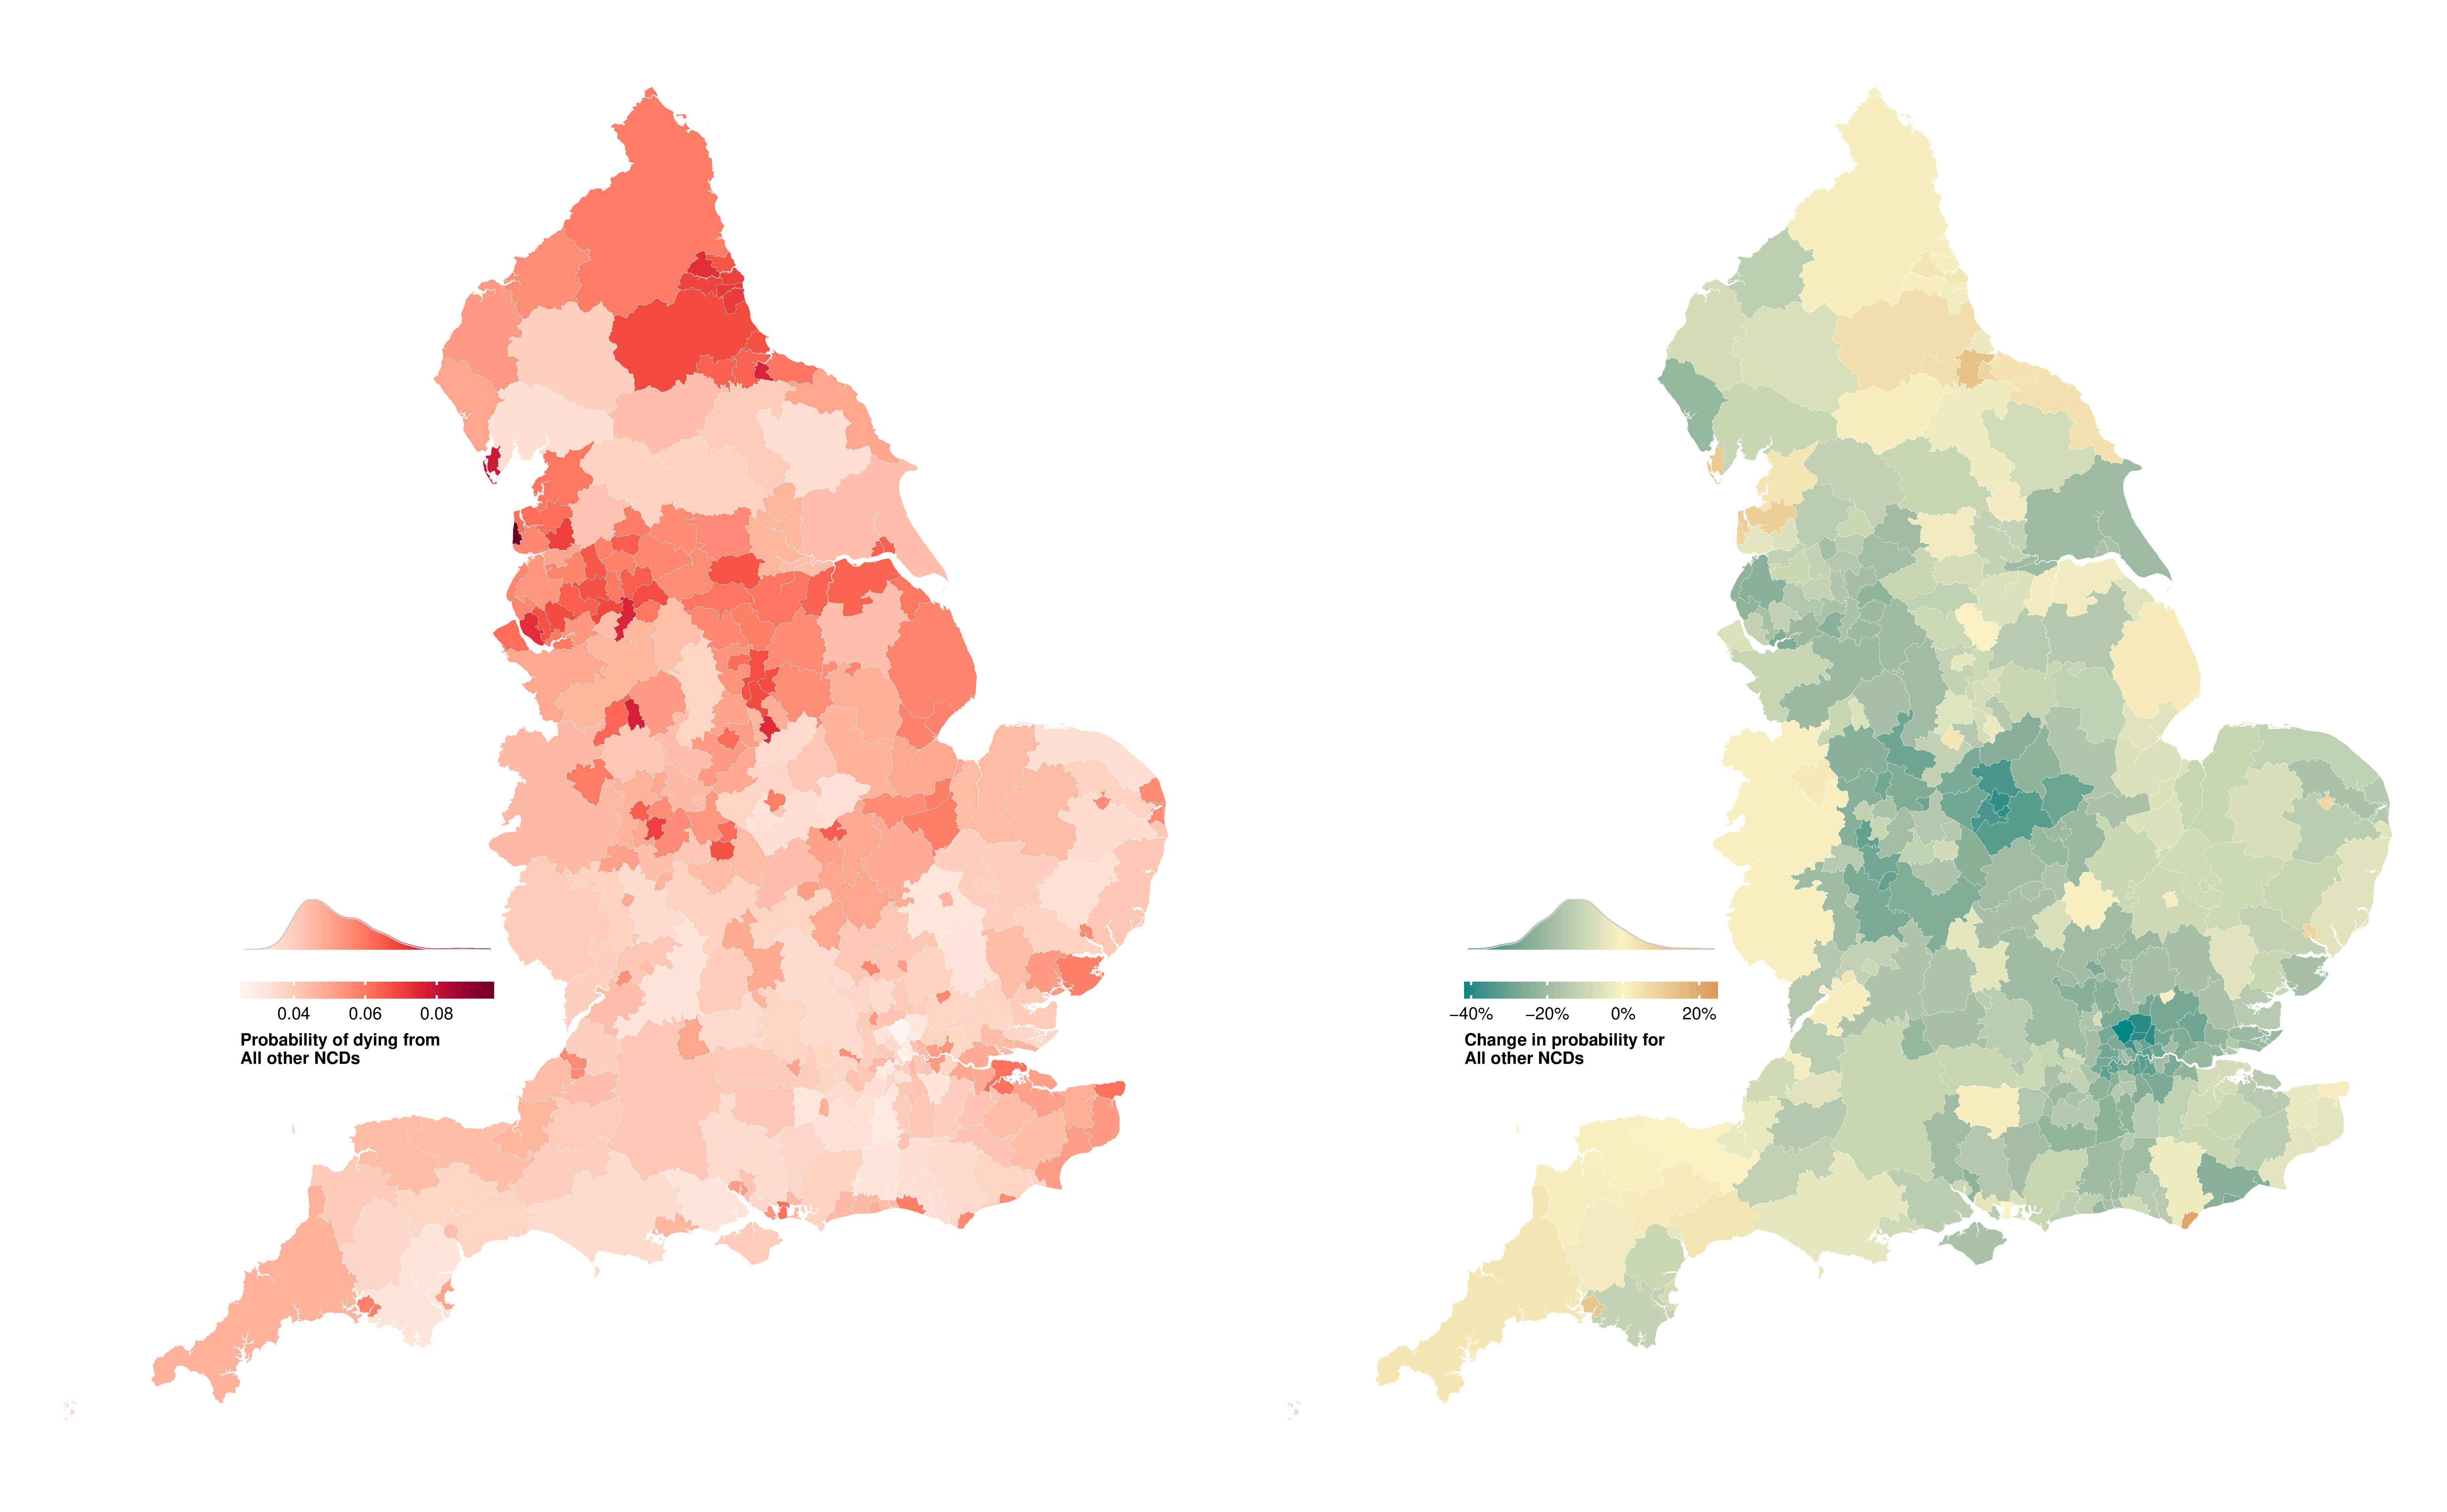
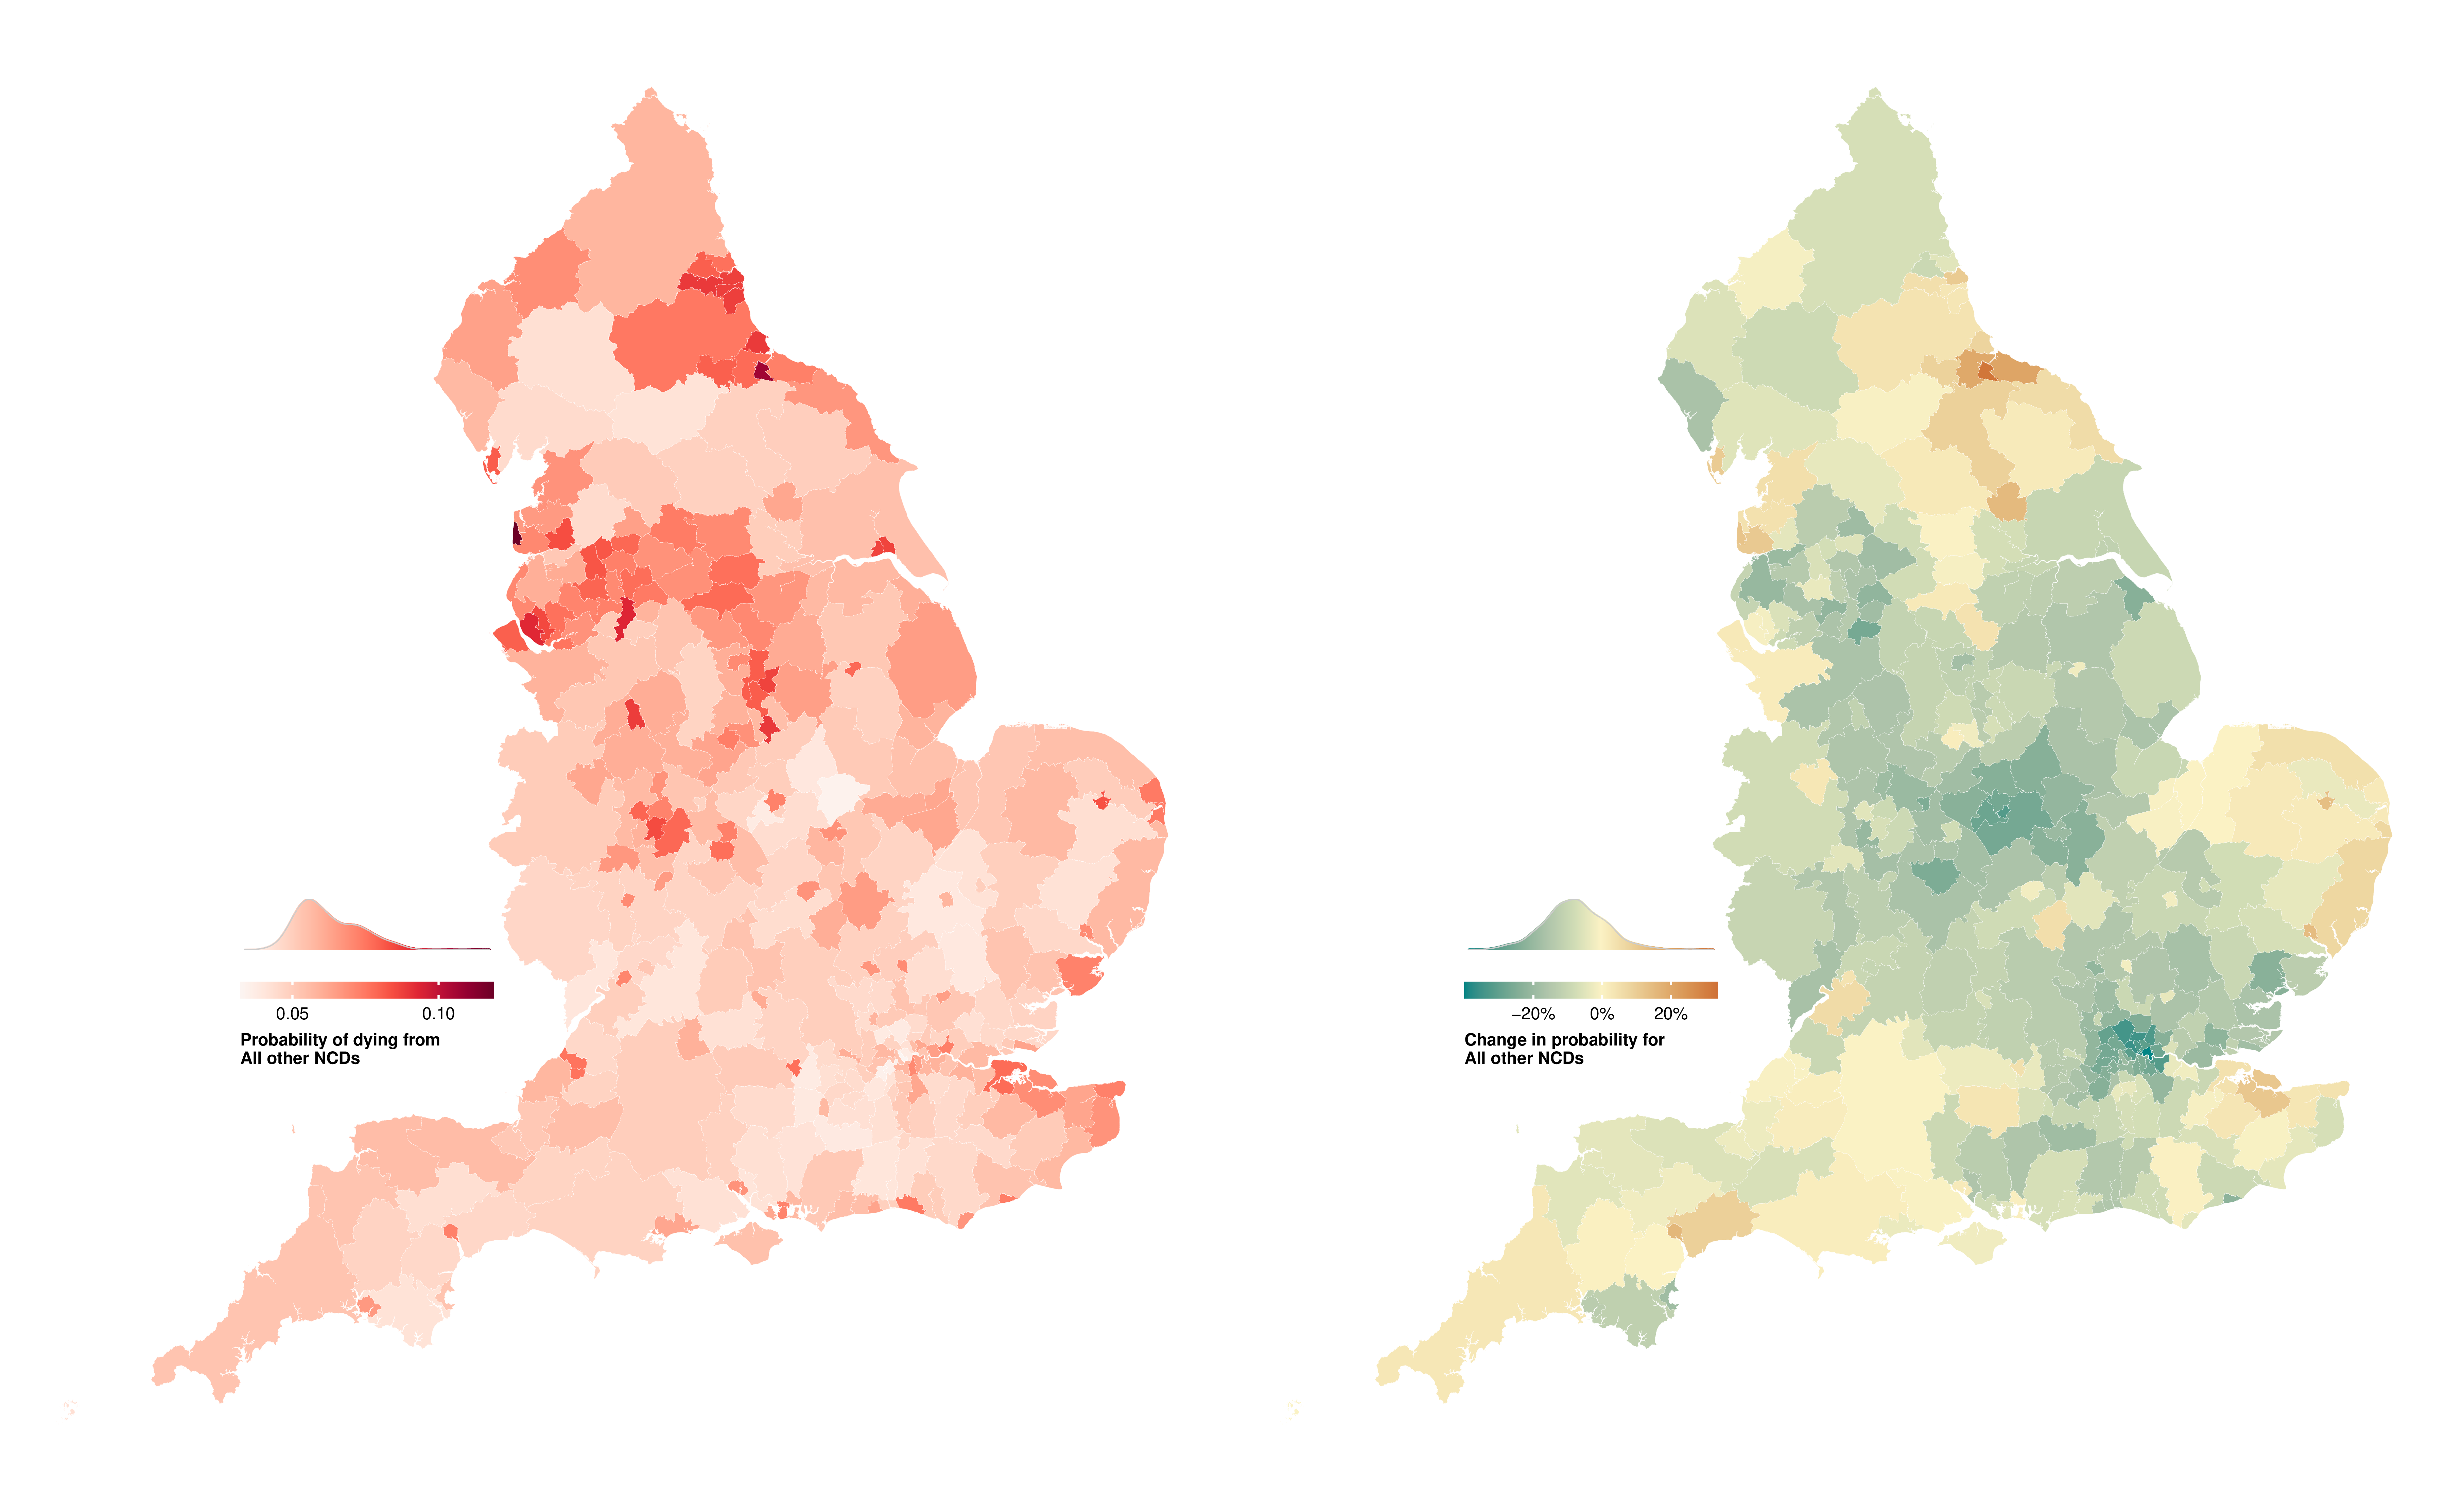
Figure E.8: Probability of dying from all other NCDs between birth and 80 years of age in 314 local authority districts in England in 2019 and change from 2002 to 2019.
(a) Women
(b) Men
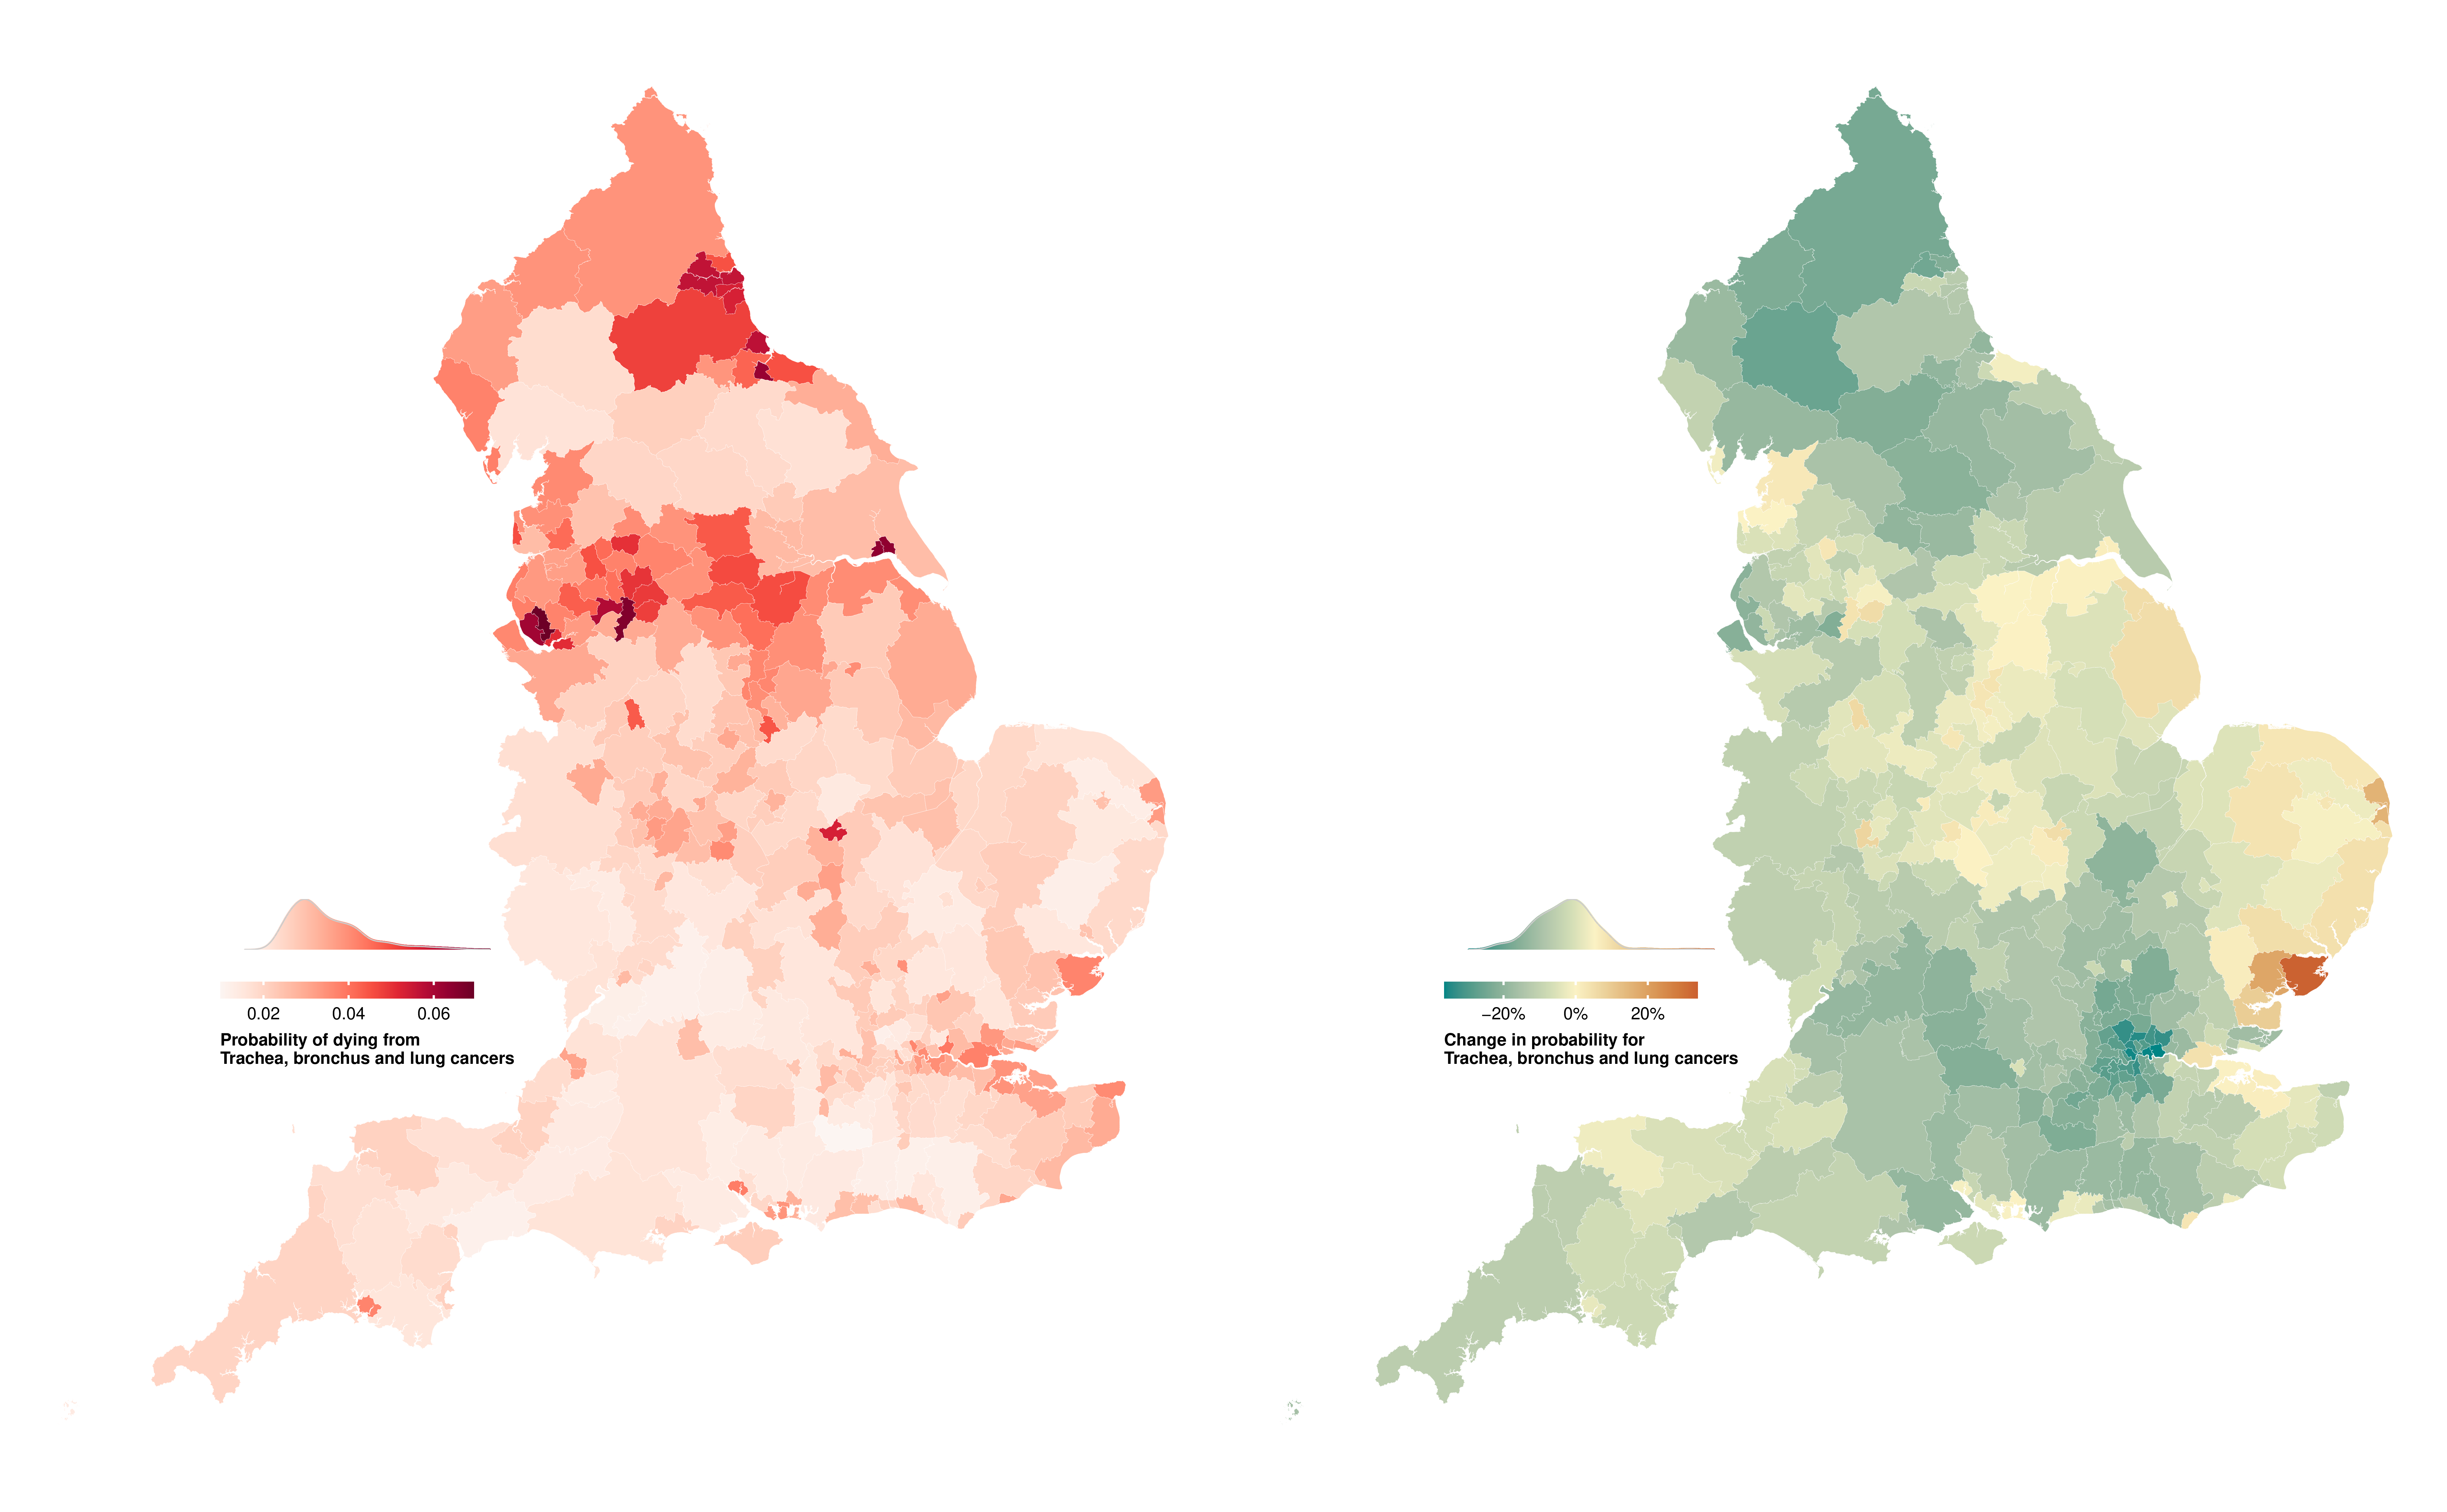
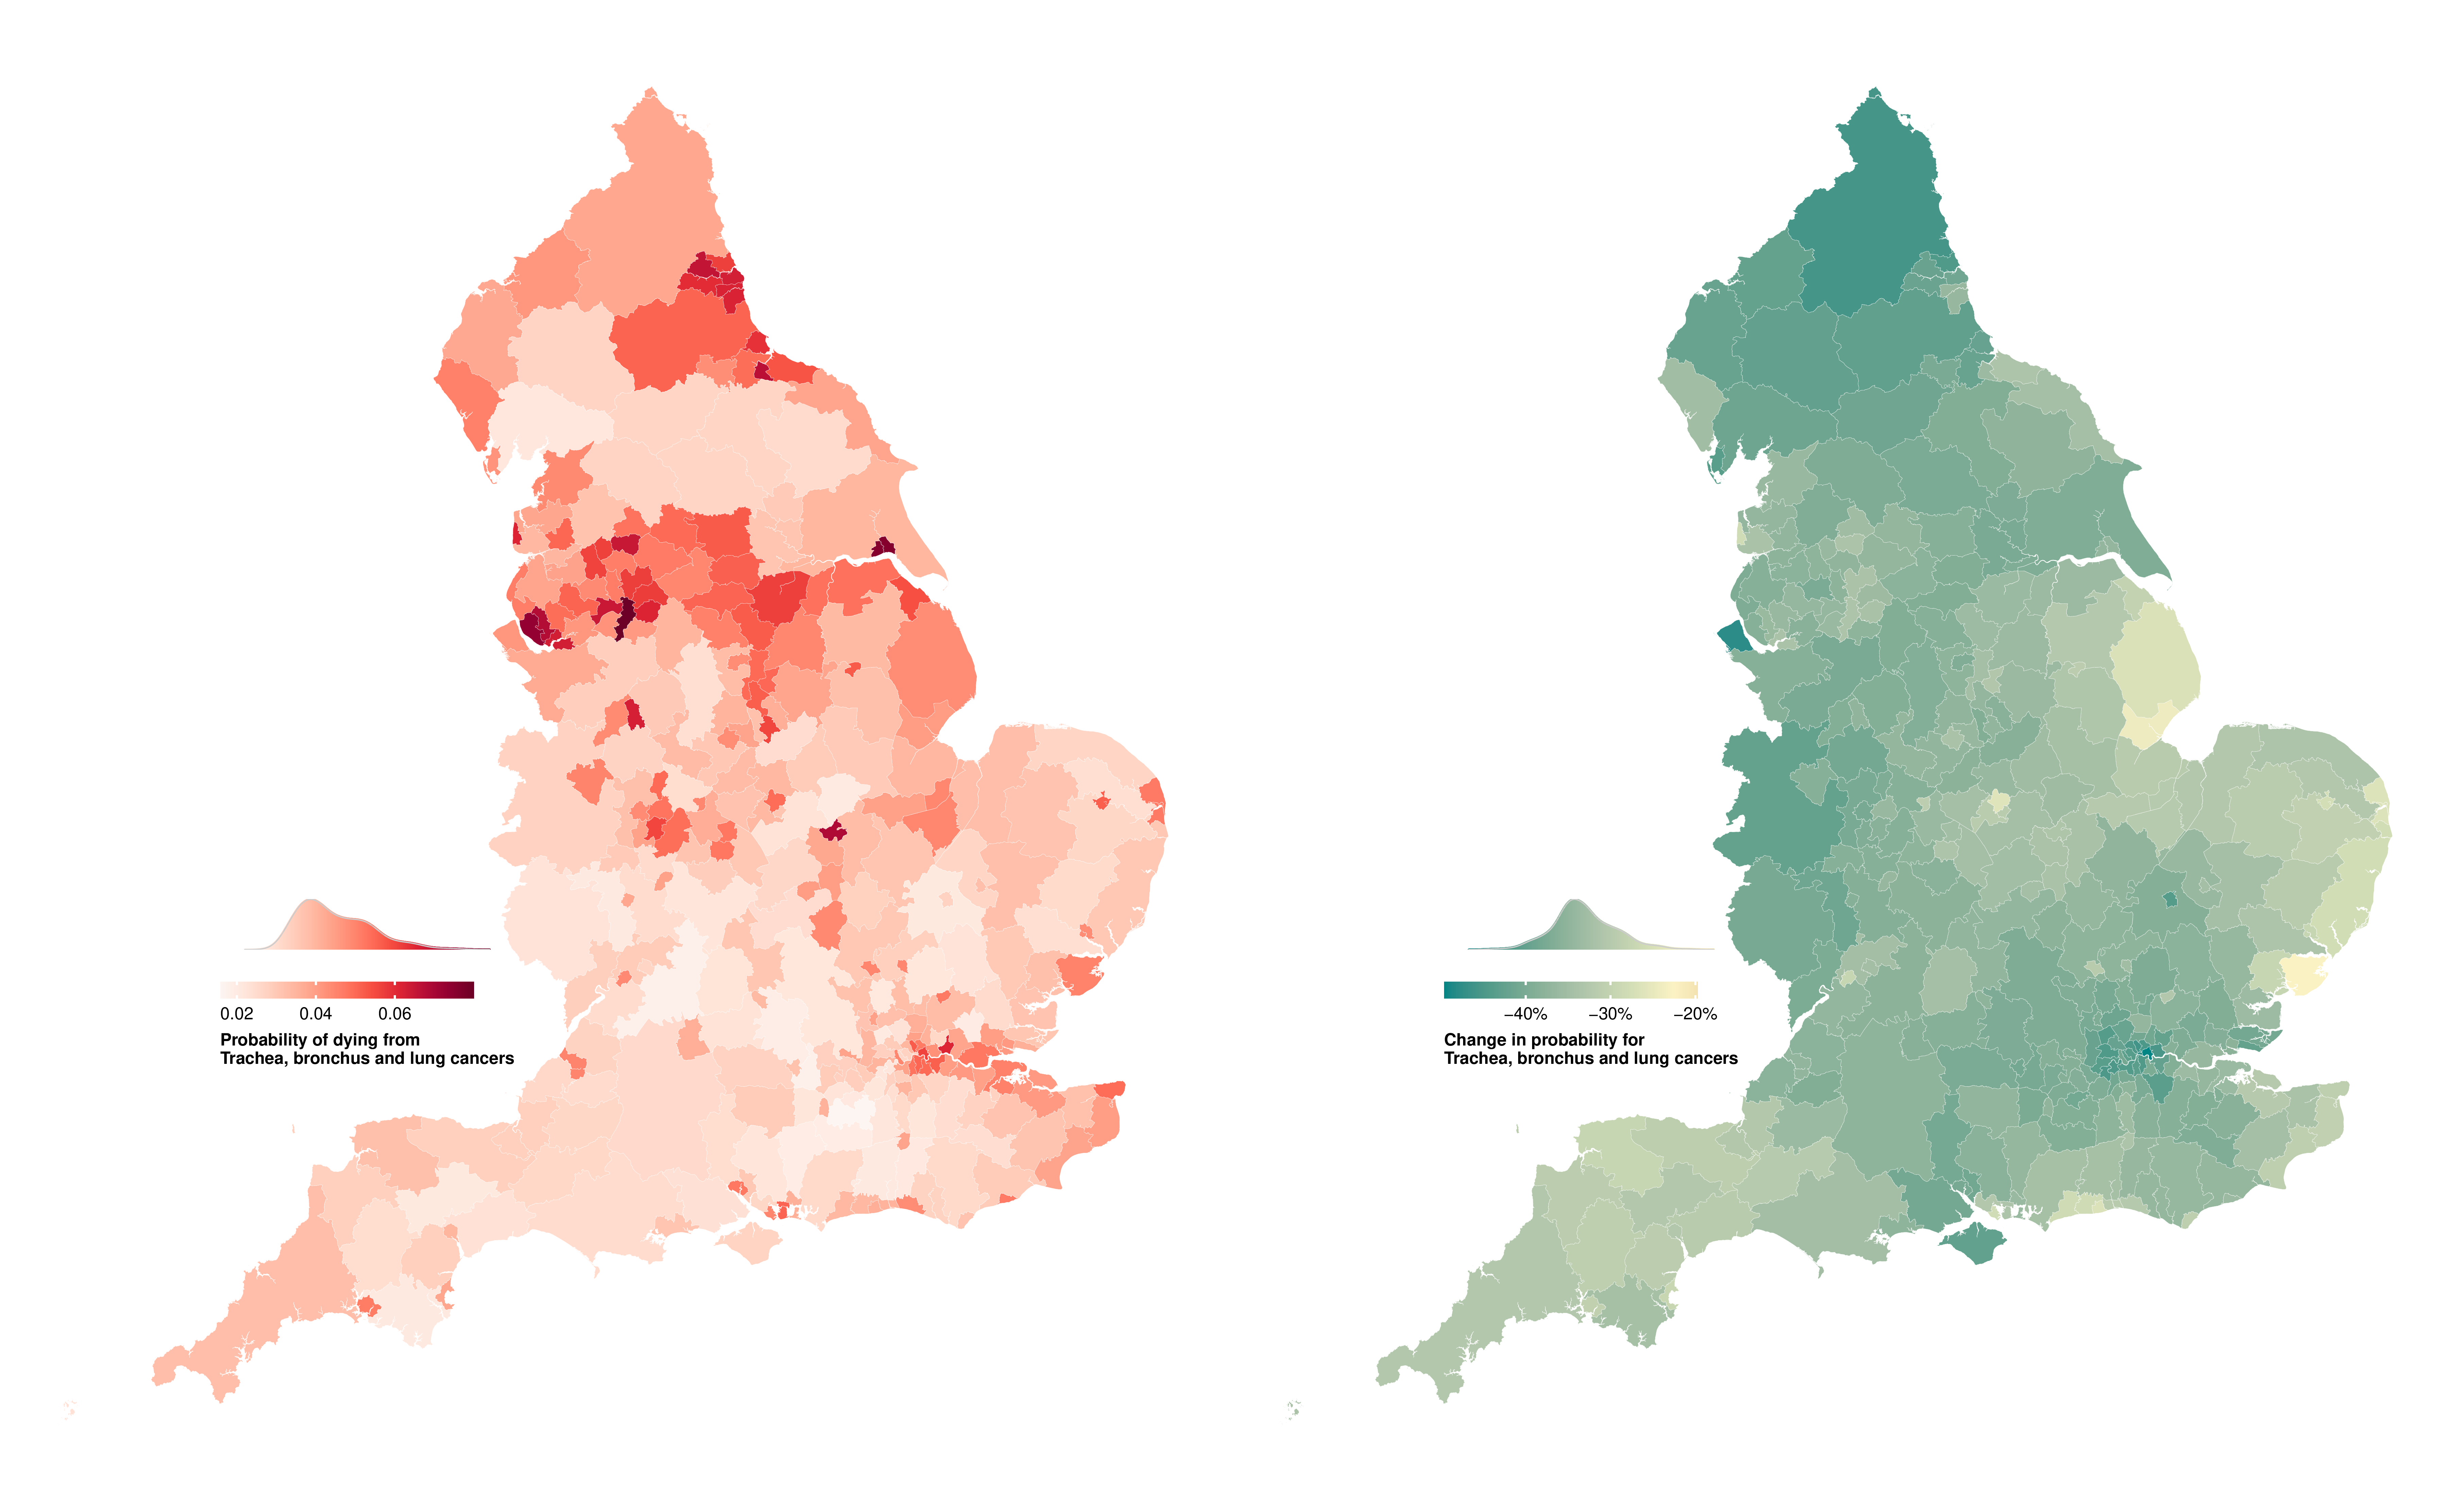
Figure E.9: Probability of dying from trachea, bronchus and lung cancers between birth and 80 years of age in 314 local authority districts in England in 2019 and change from 2002 to 2019.
(a) Women
(b) Men
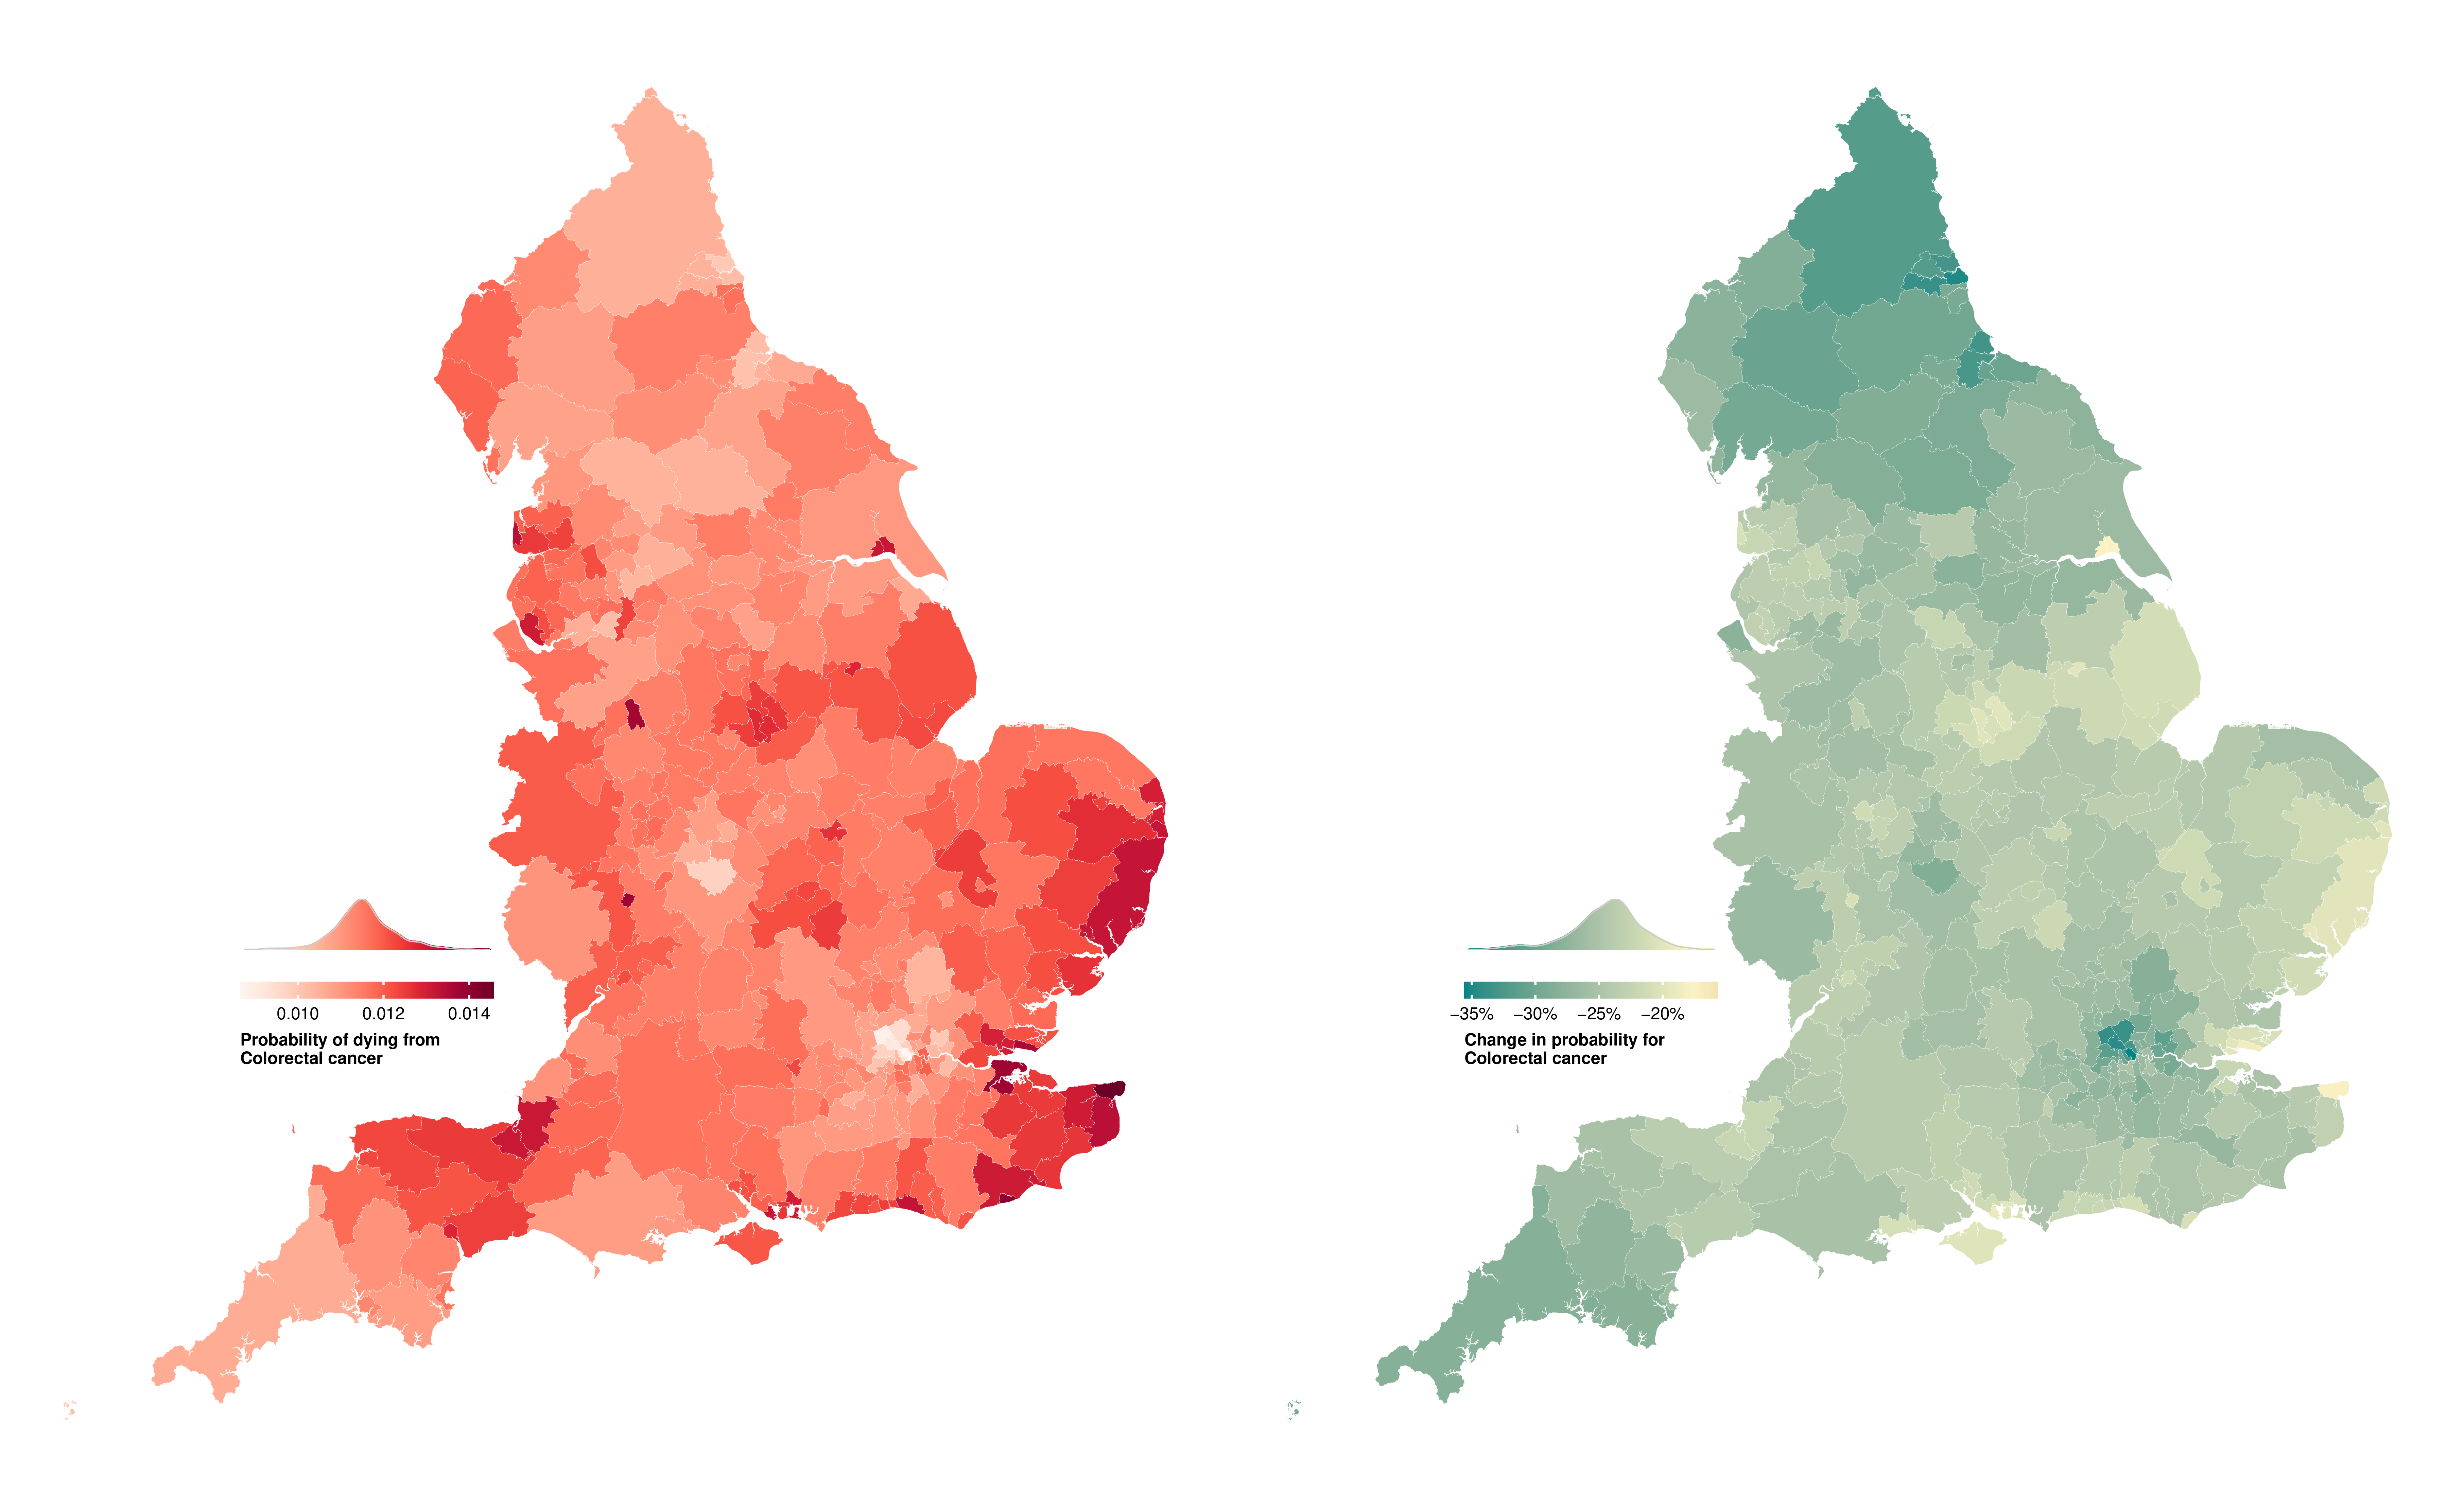
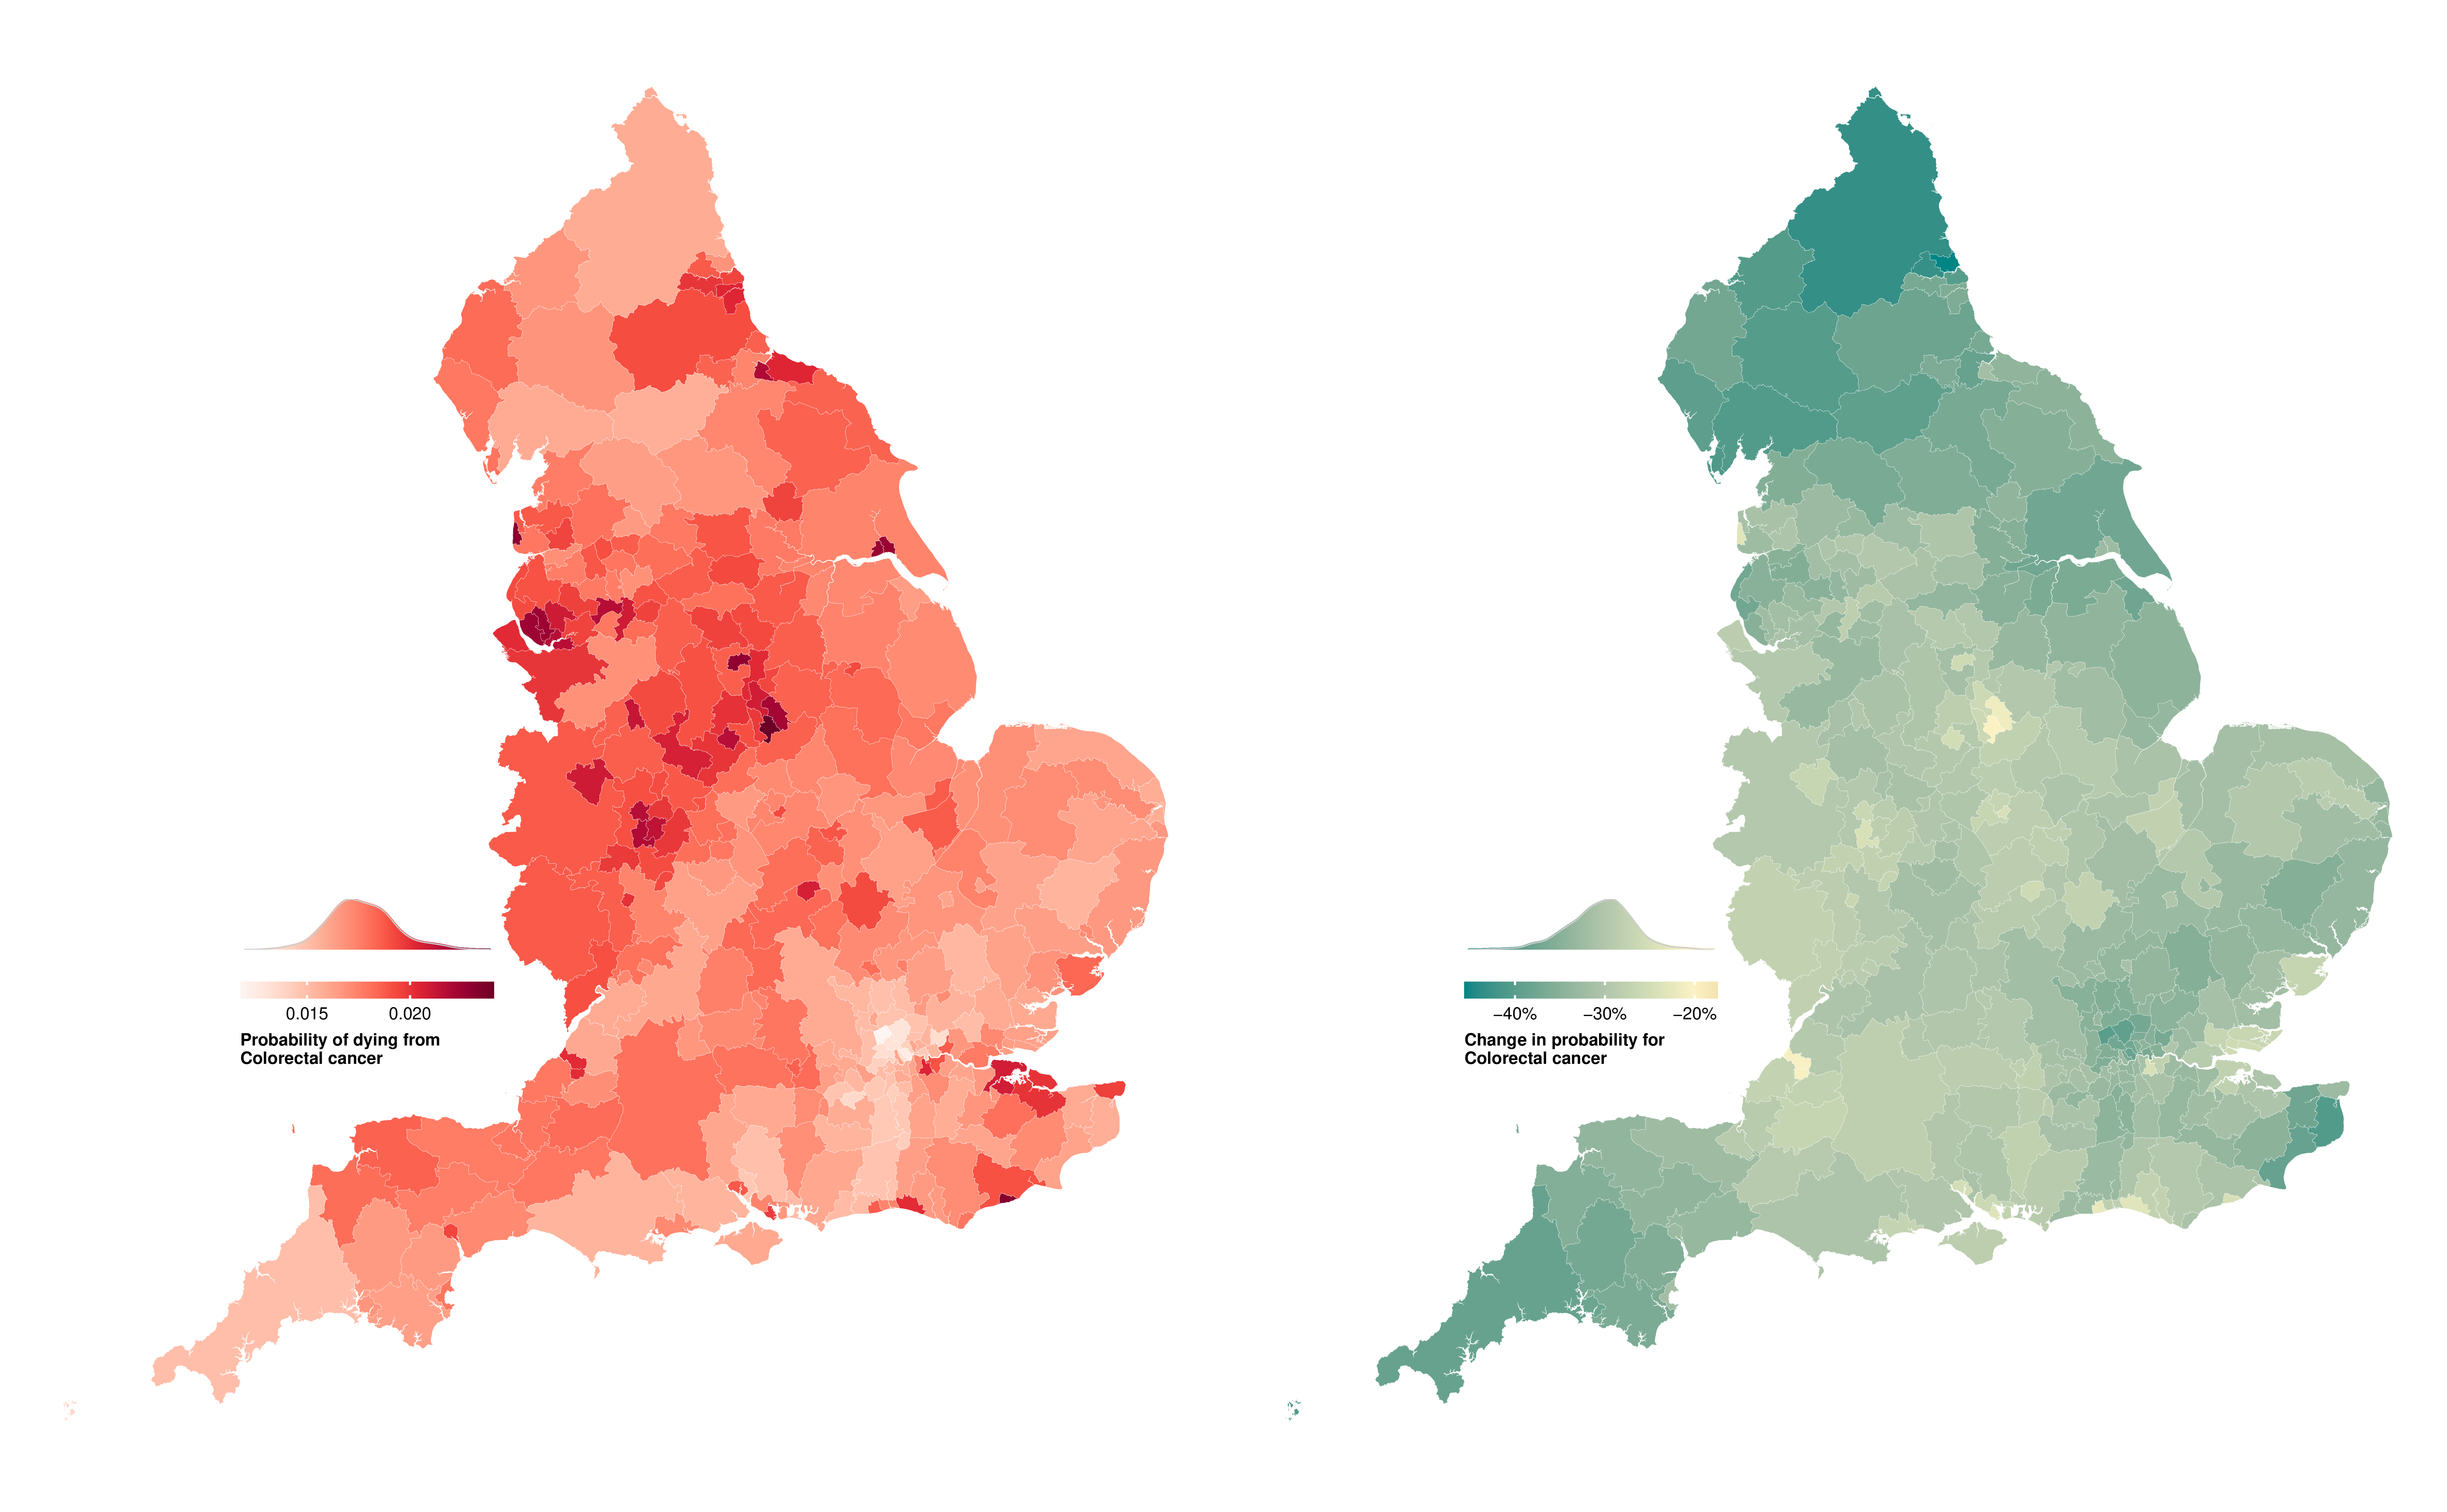
Figure E.10: Probability of dying from colorectal cancer between birth and 80 years of age in 314 local authority districts in England in 2019 and change from 2002 to 2019.
(a) Women
(b) Men
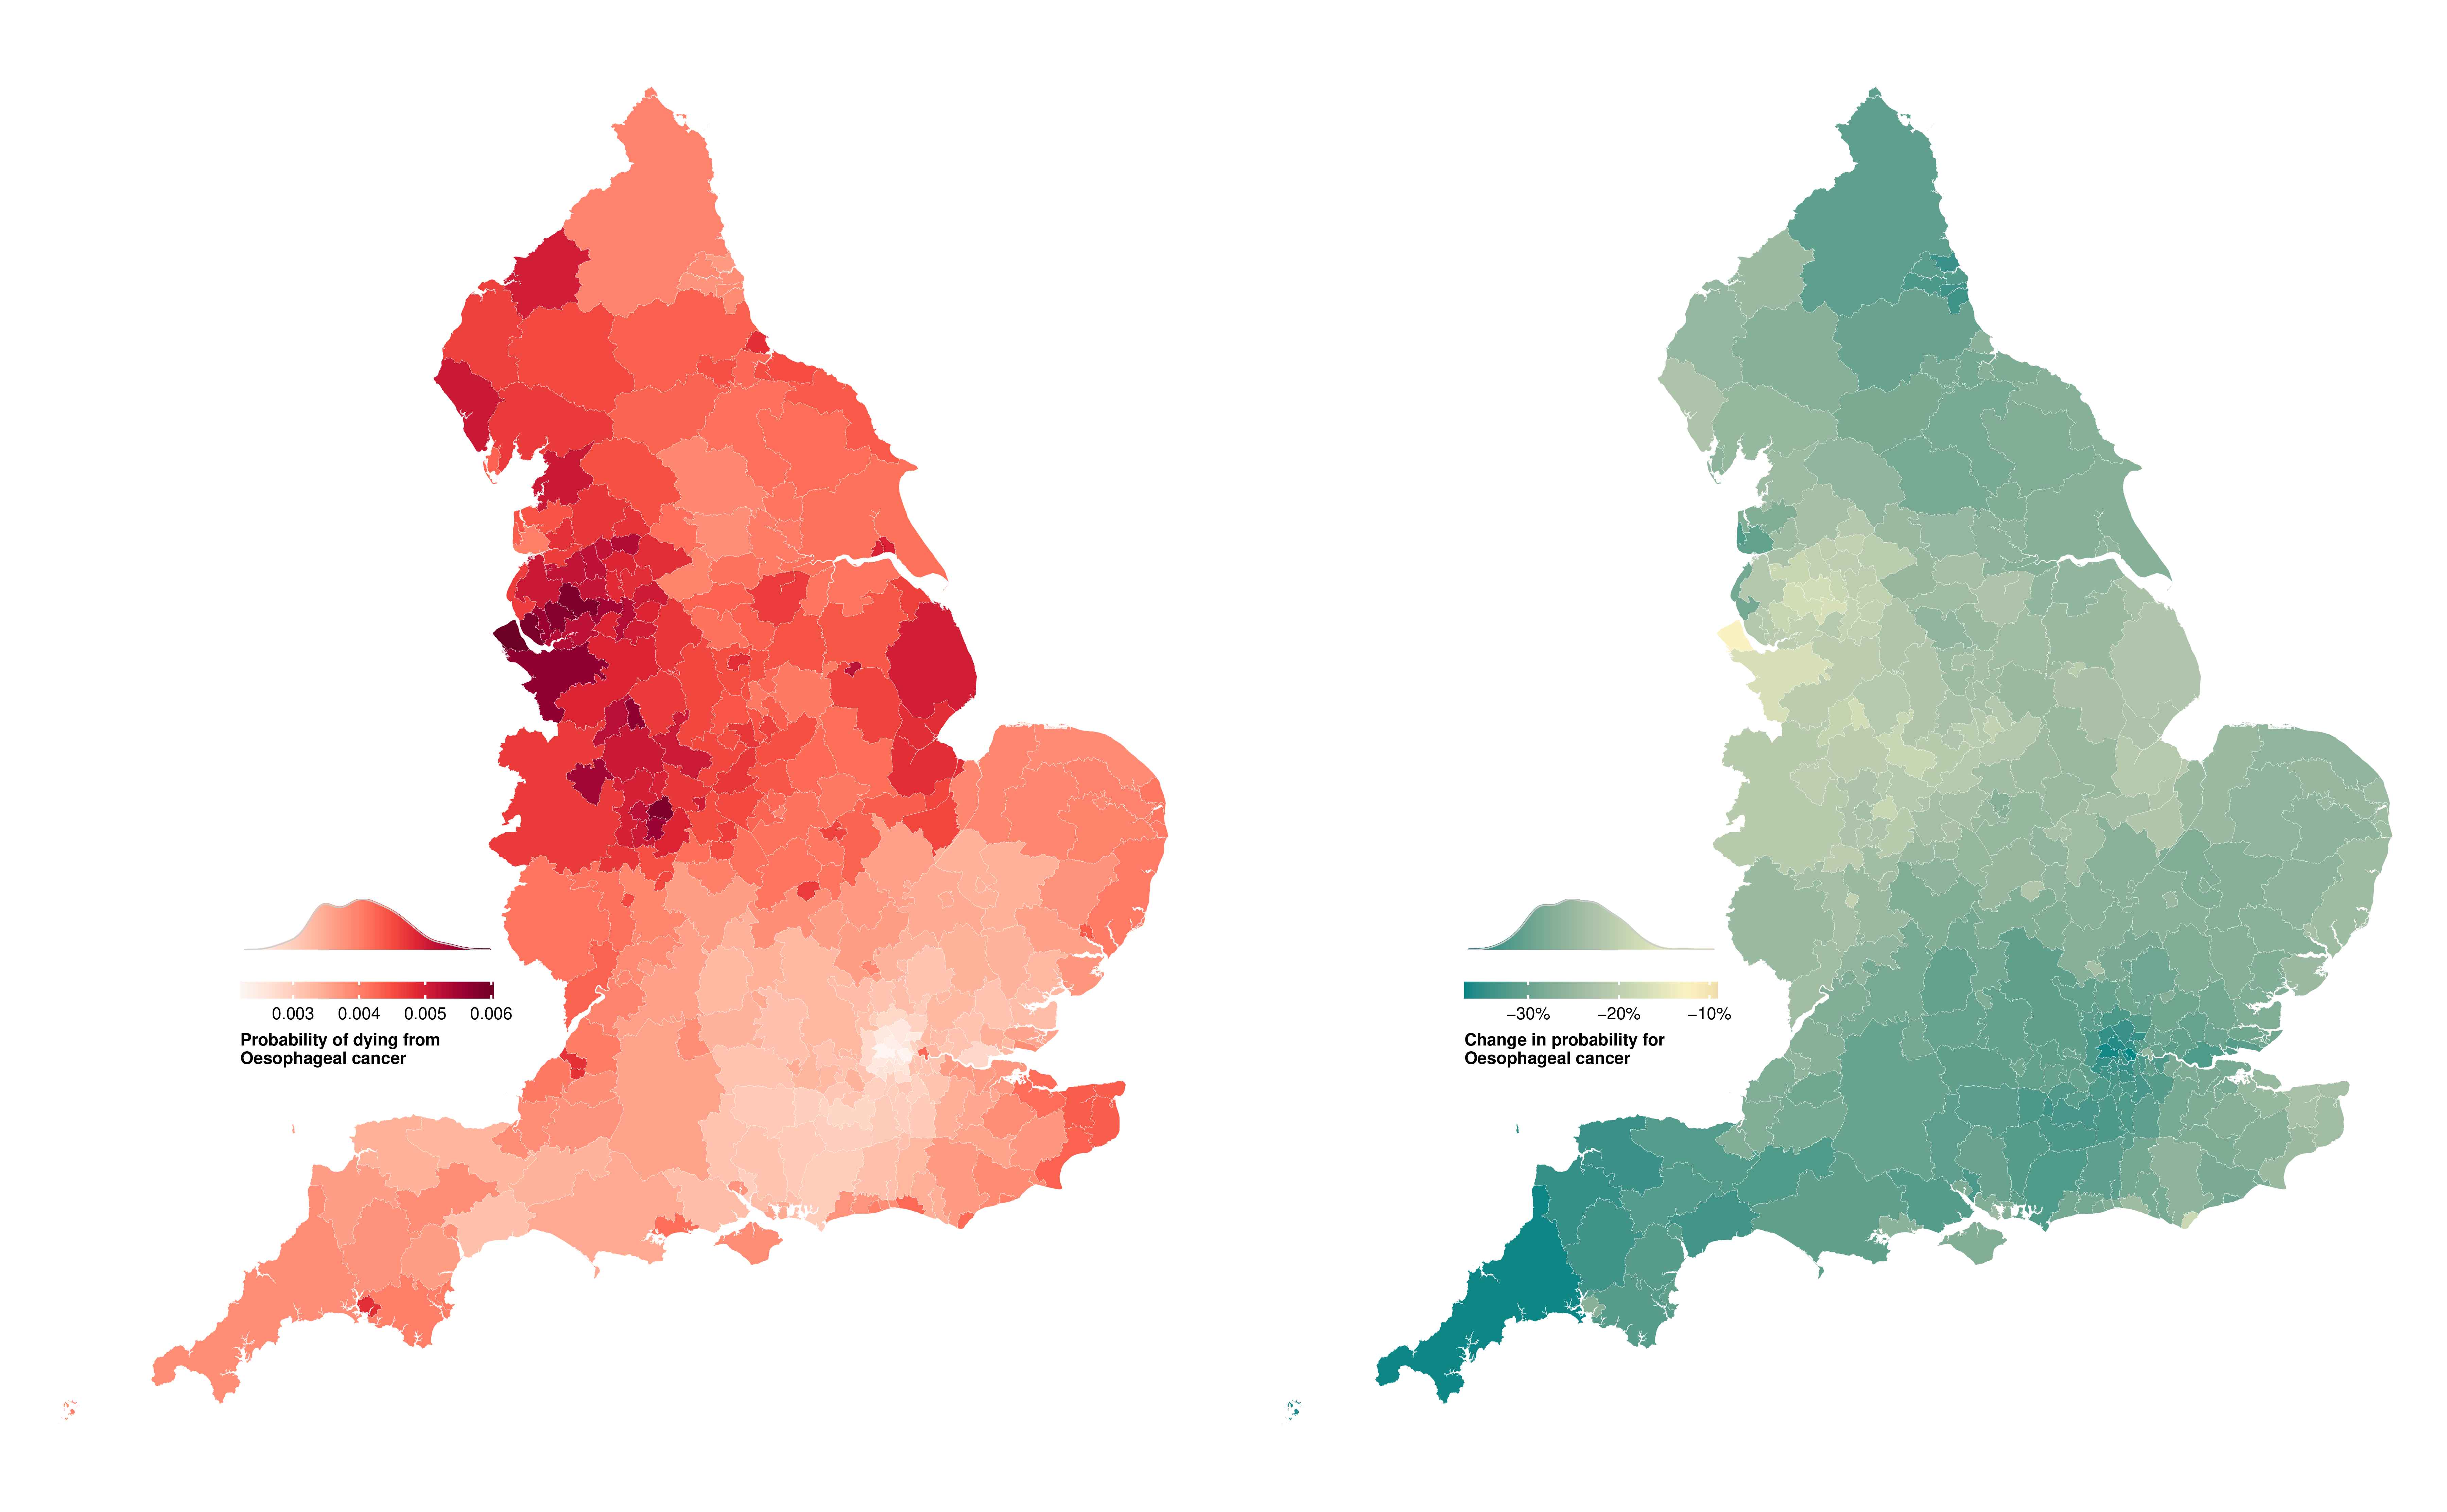
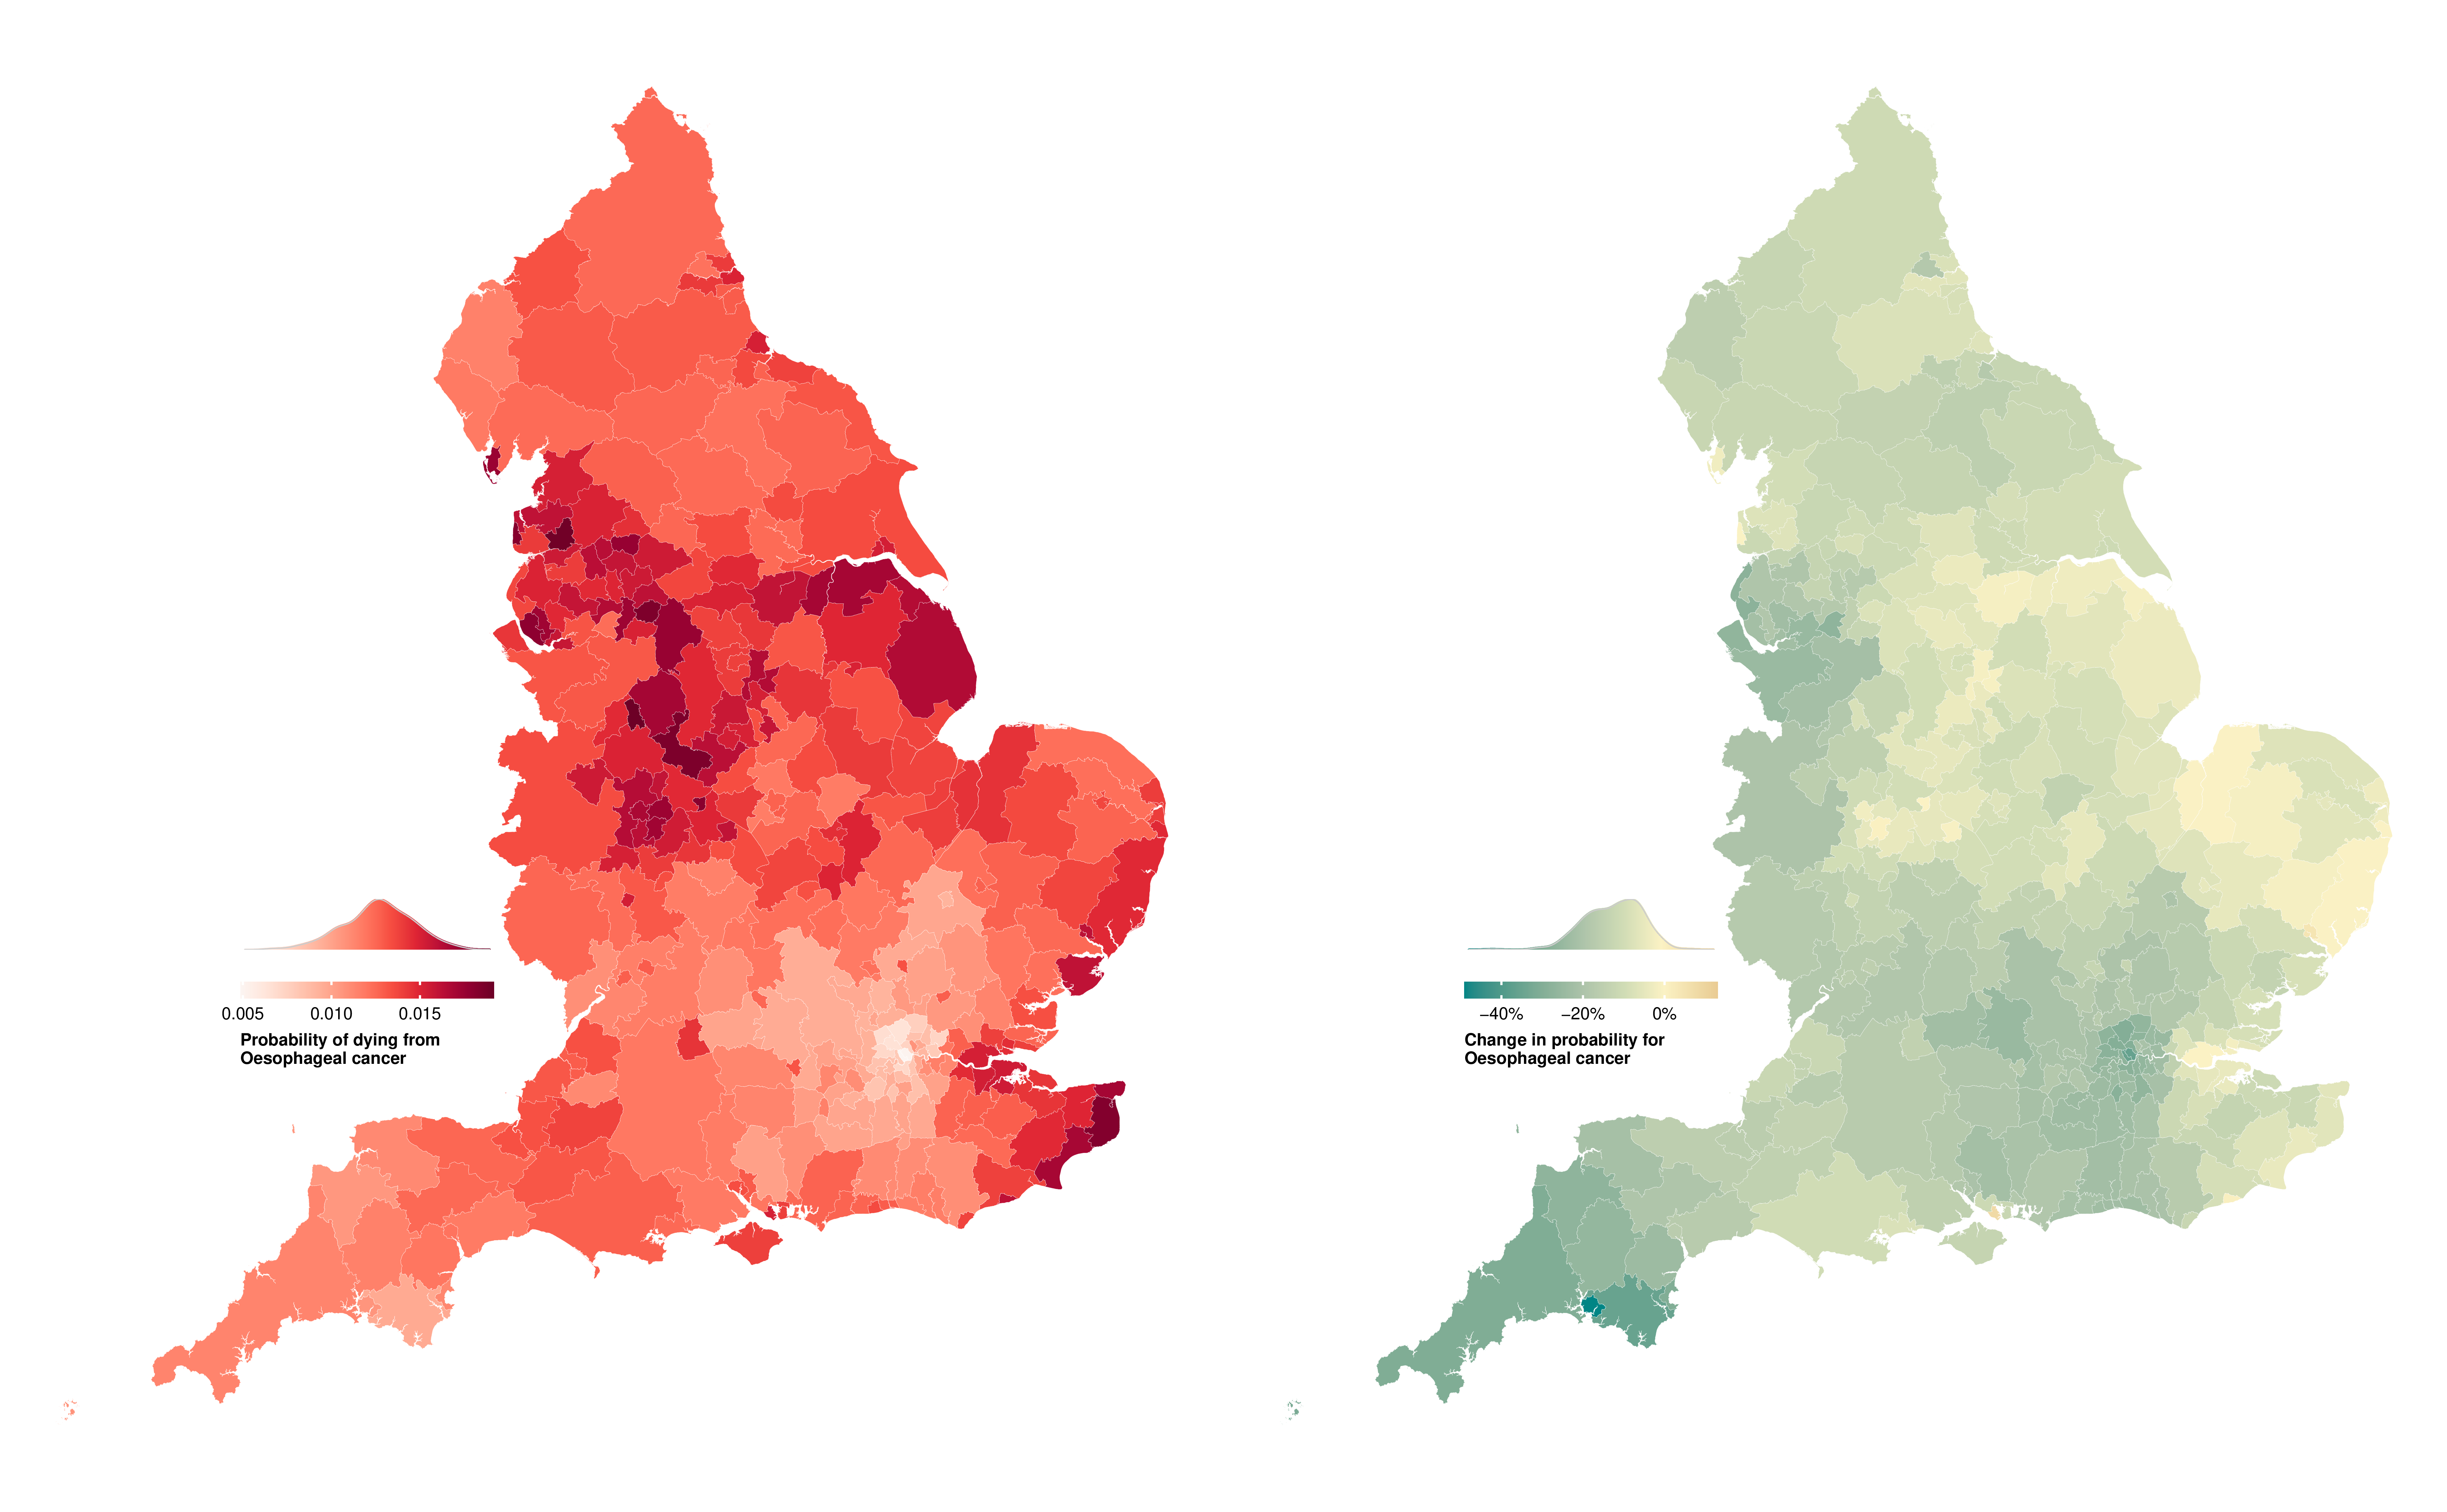
Figure E.11: Probability of dying from oesophageal cancer between birth and 80 years of age in 314 local authority districts in England in 2019 and change from 2002 to 2019.
(a) Women
(b) Men
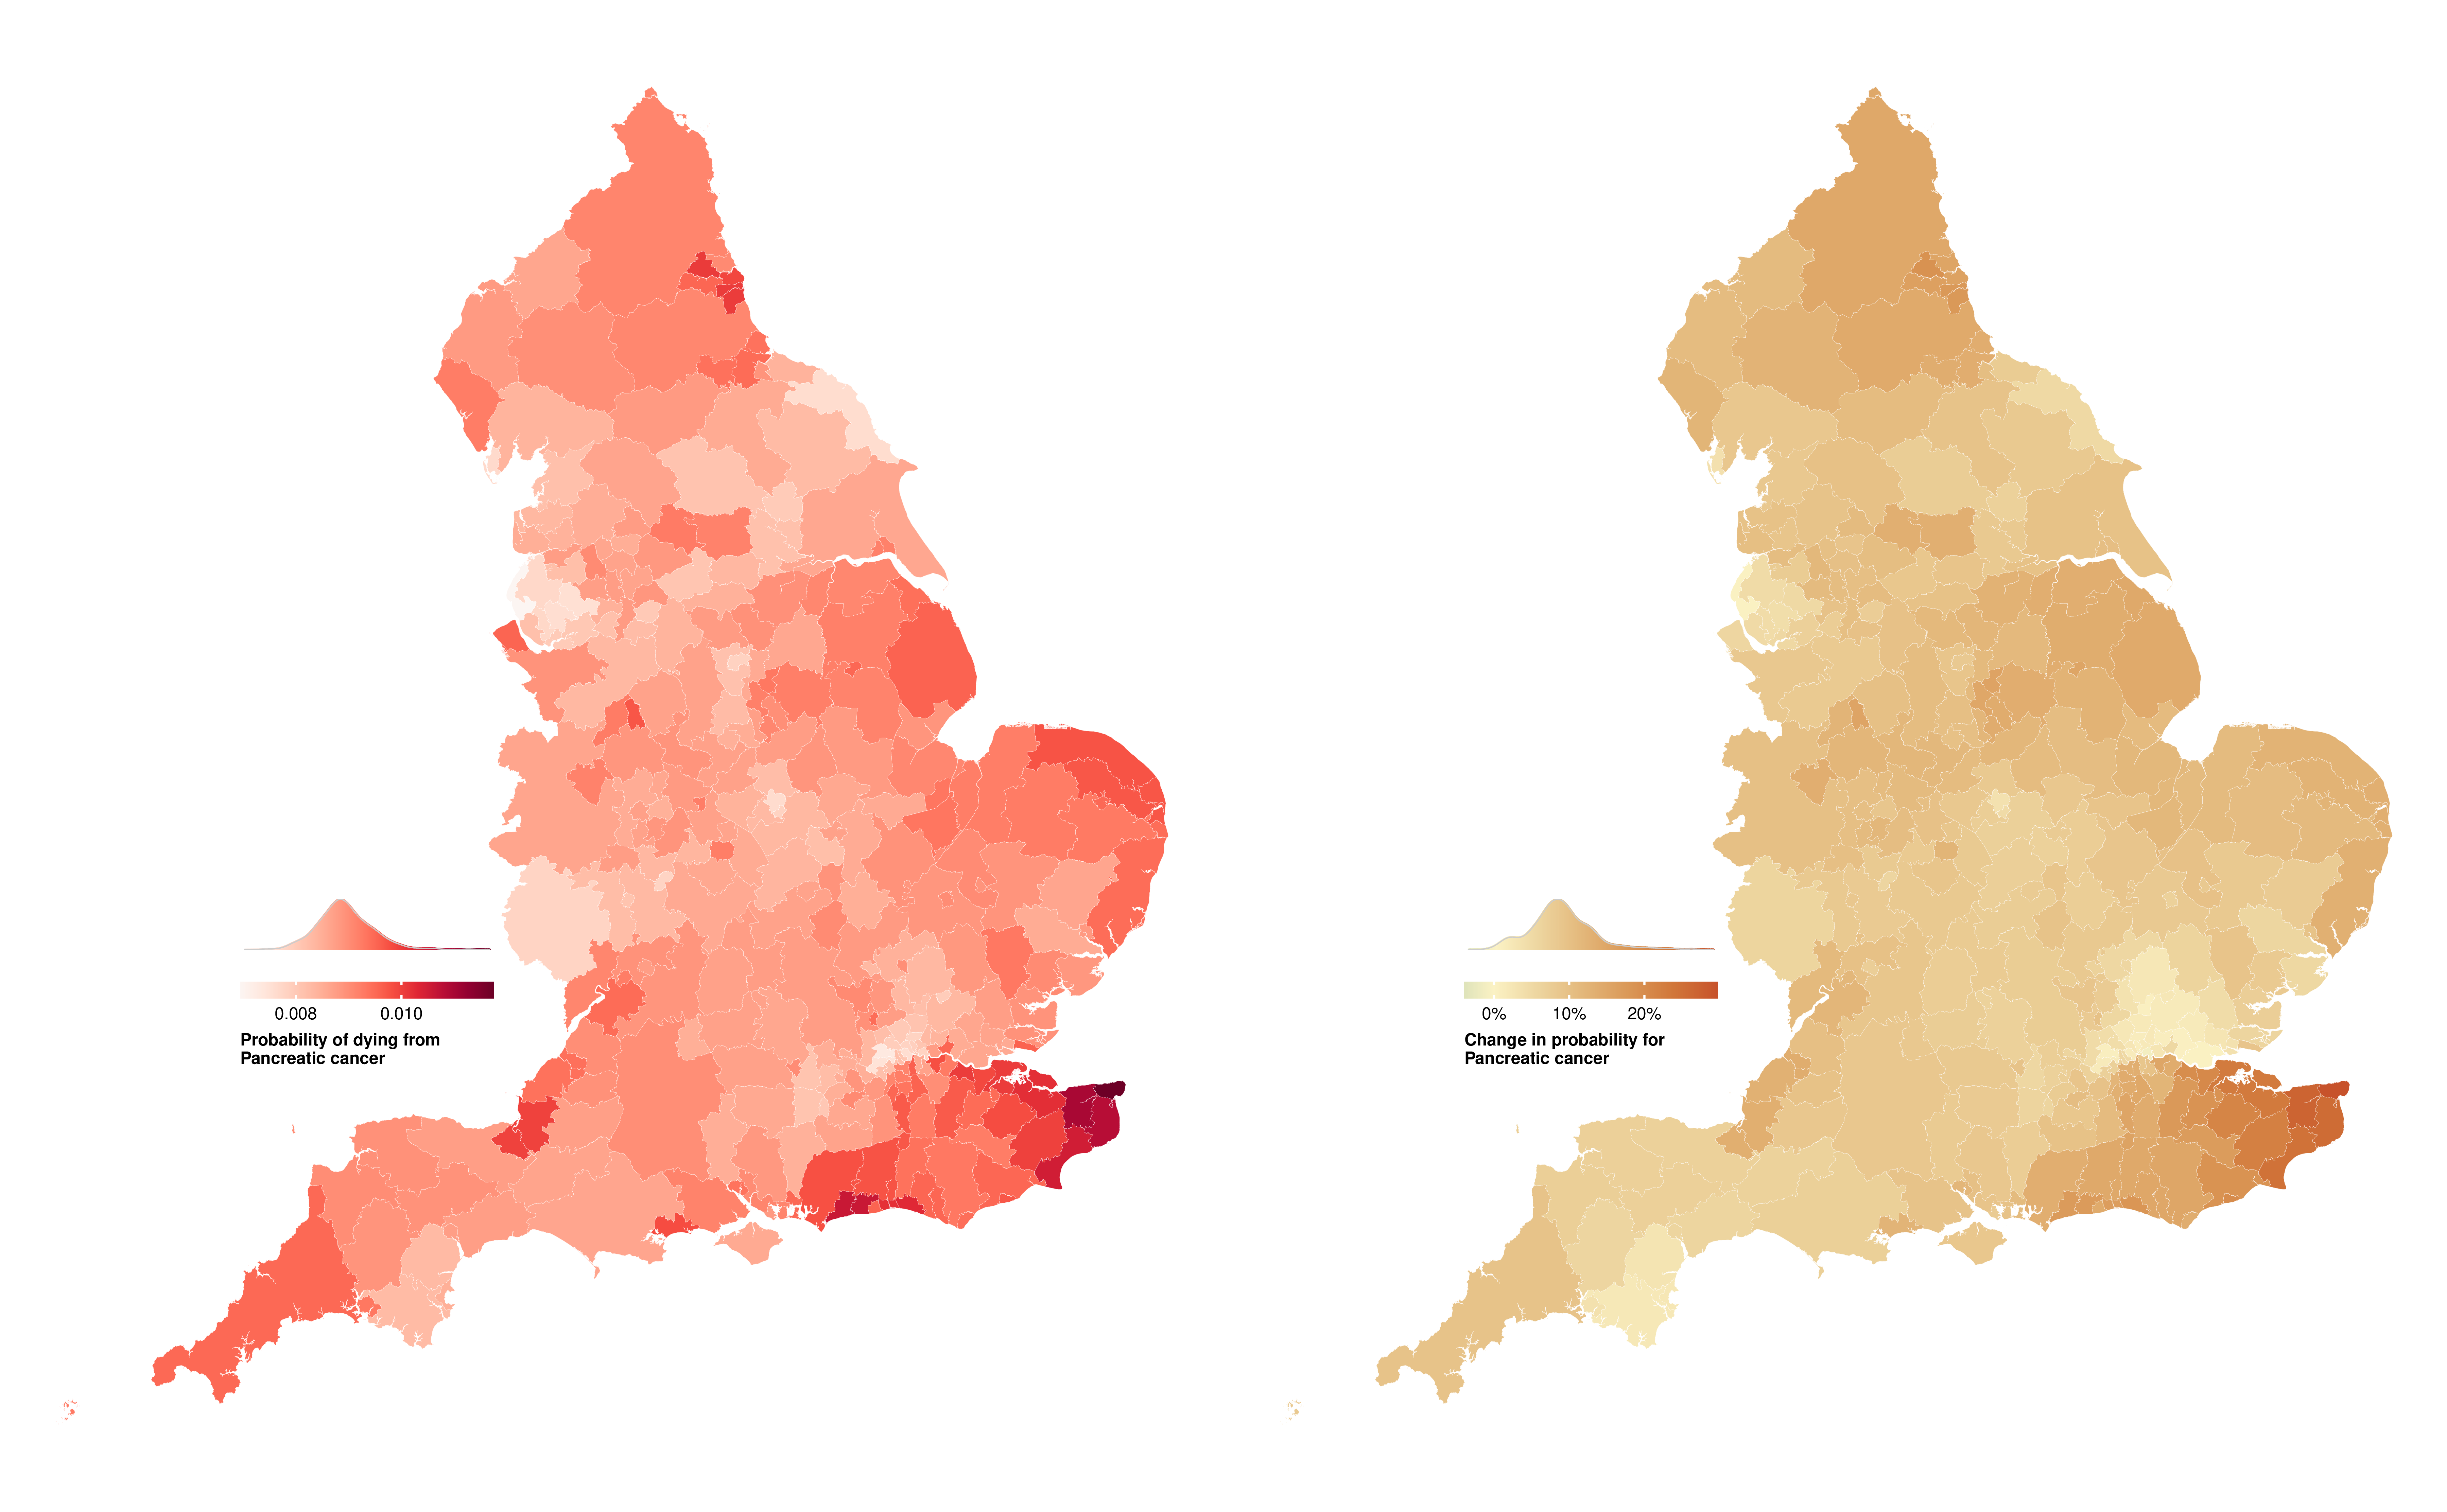
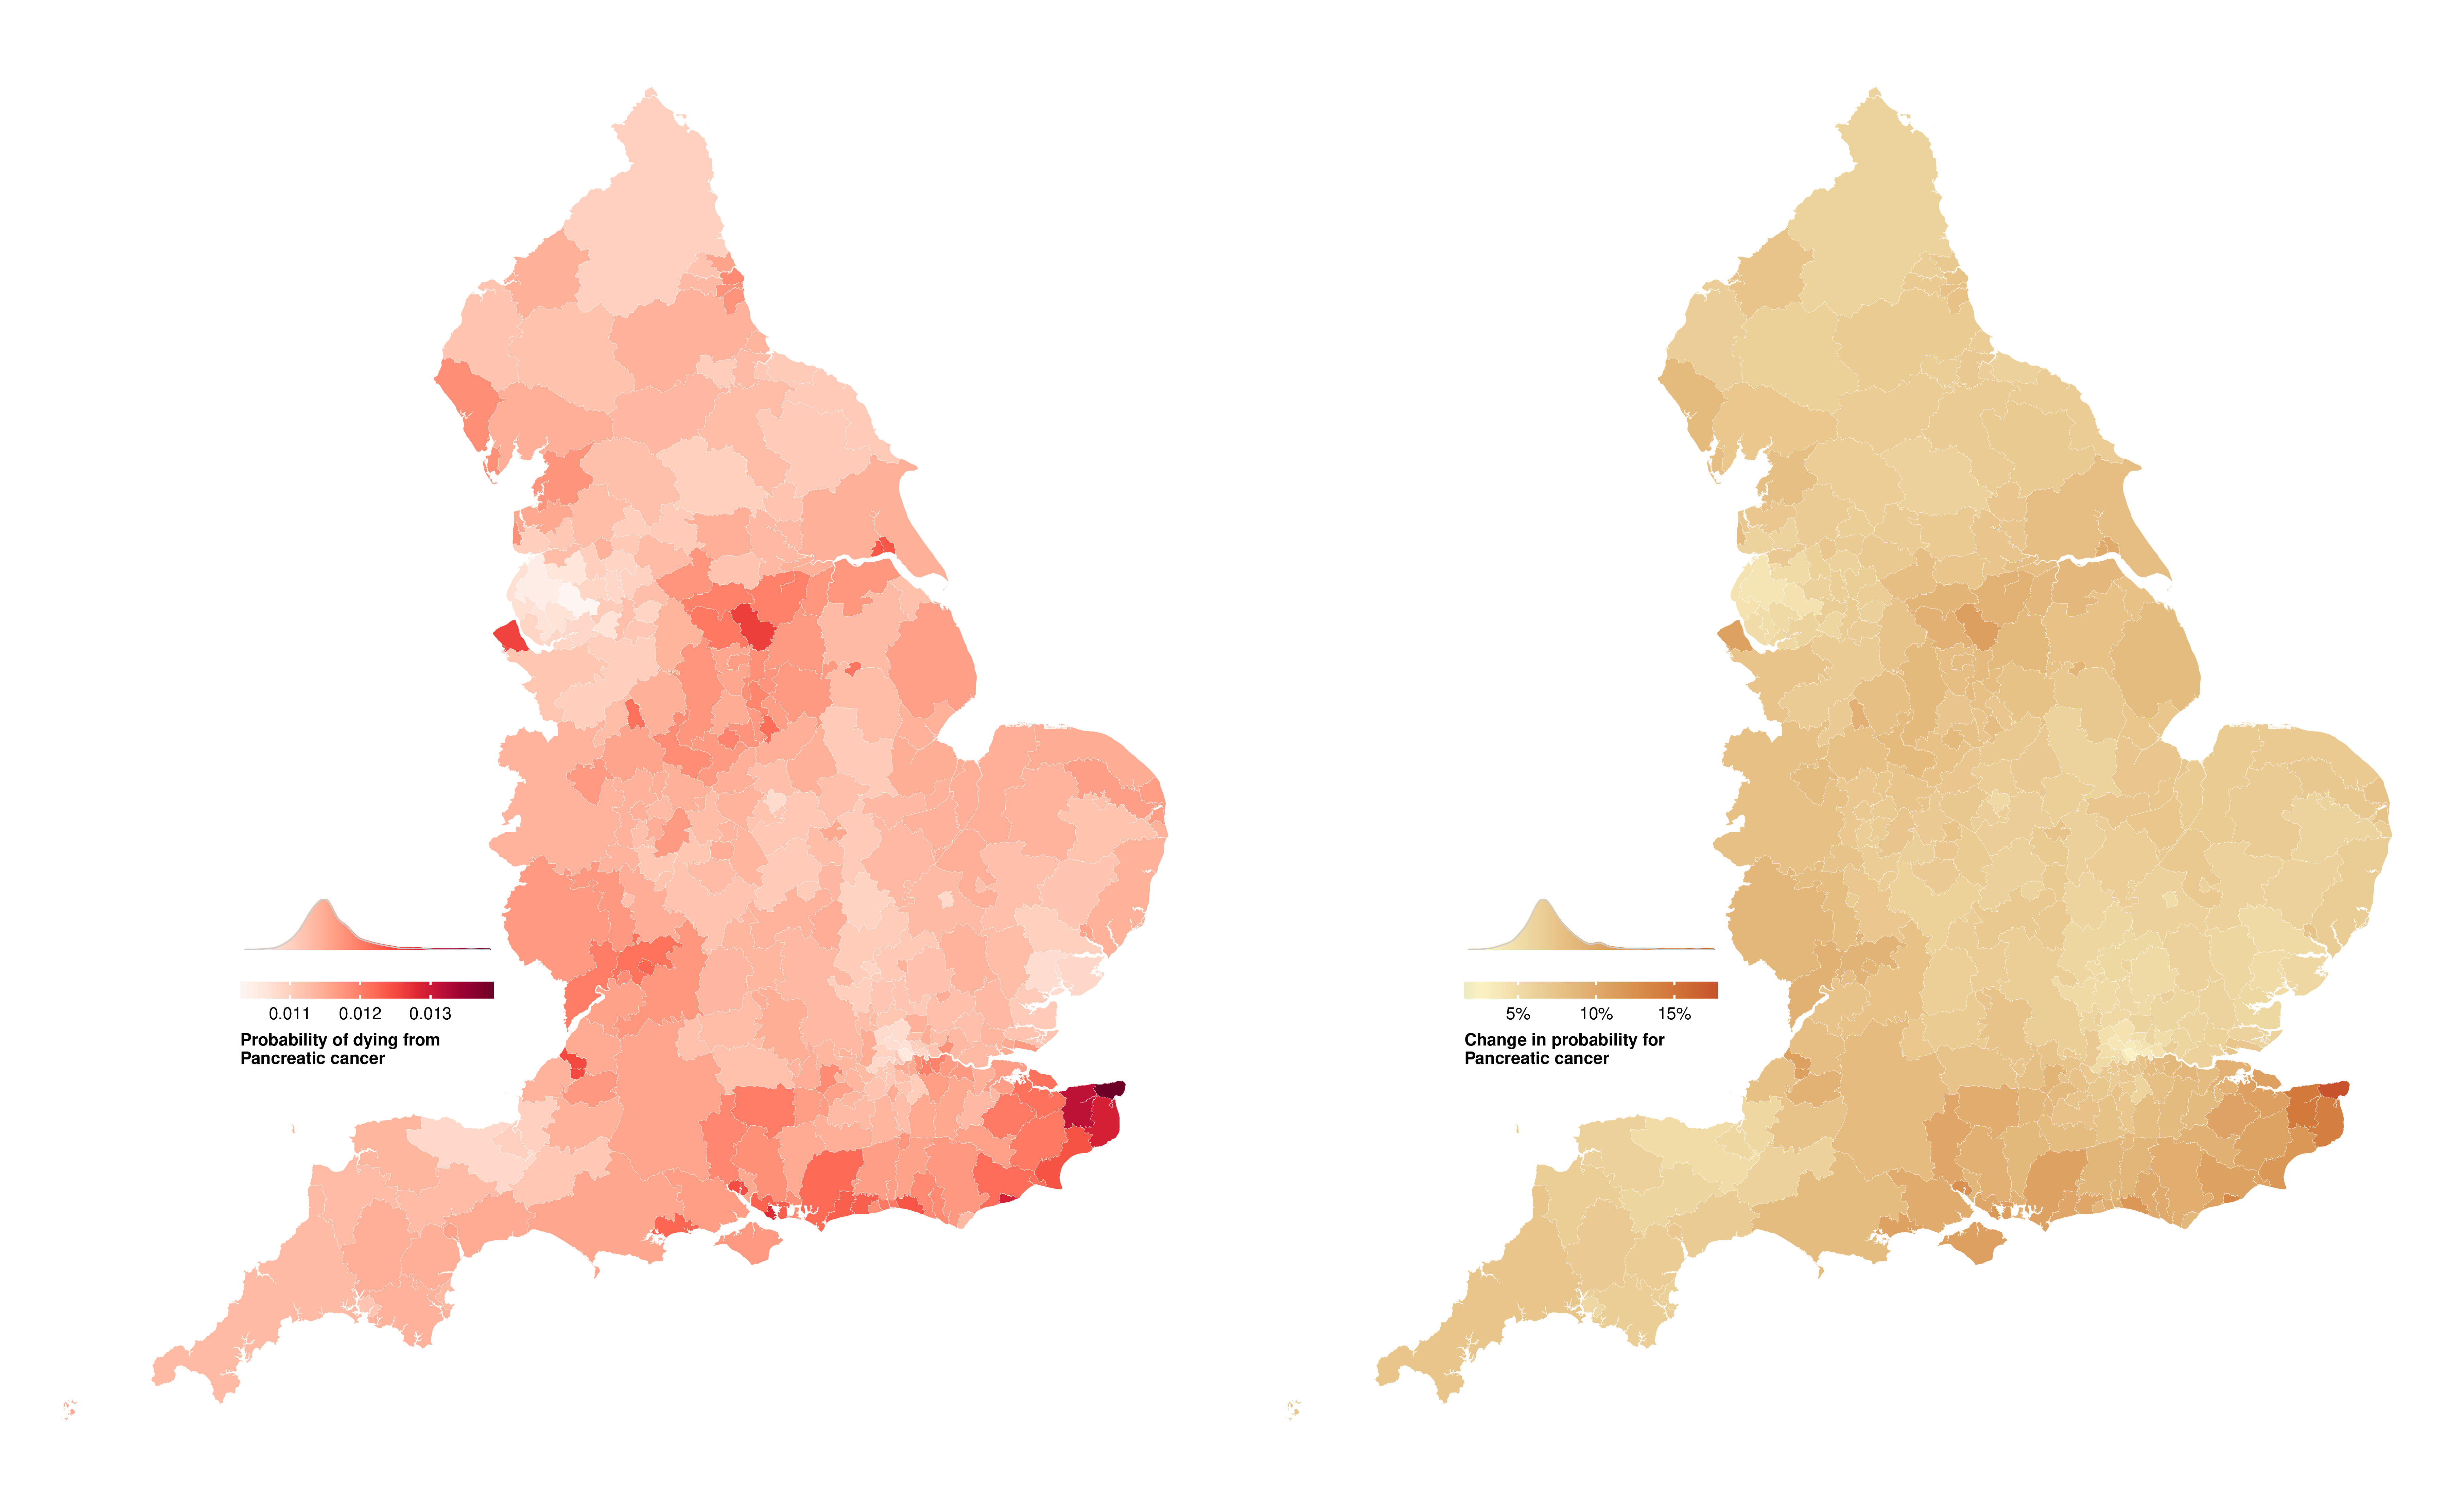
Figure E.12: Probability of dying from pancreatic cancer between birth and 80 years of age in 314 local authority districts in England in 2019 and change from 2002 to 2019.
(a) Women
(b) Men
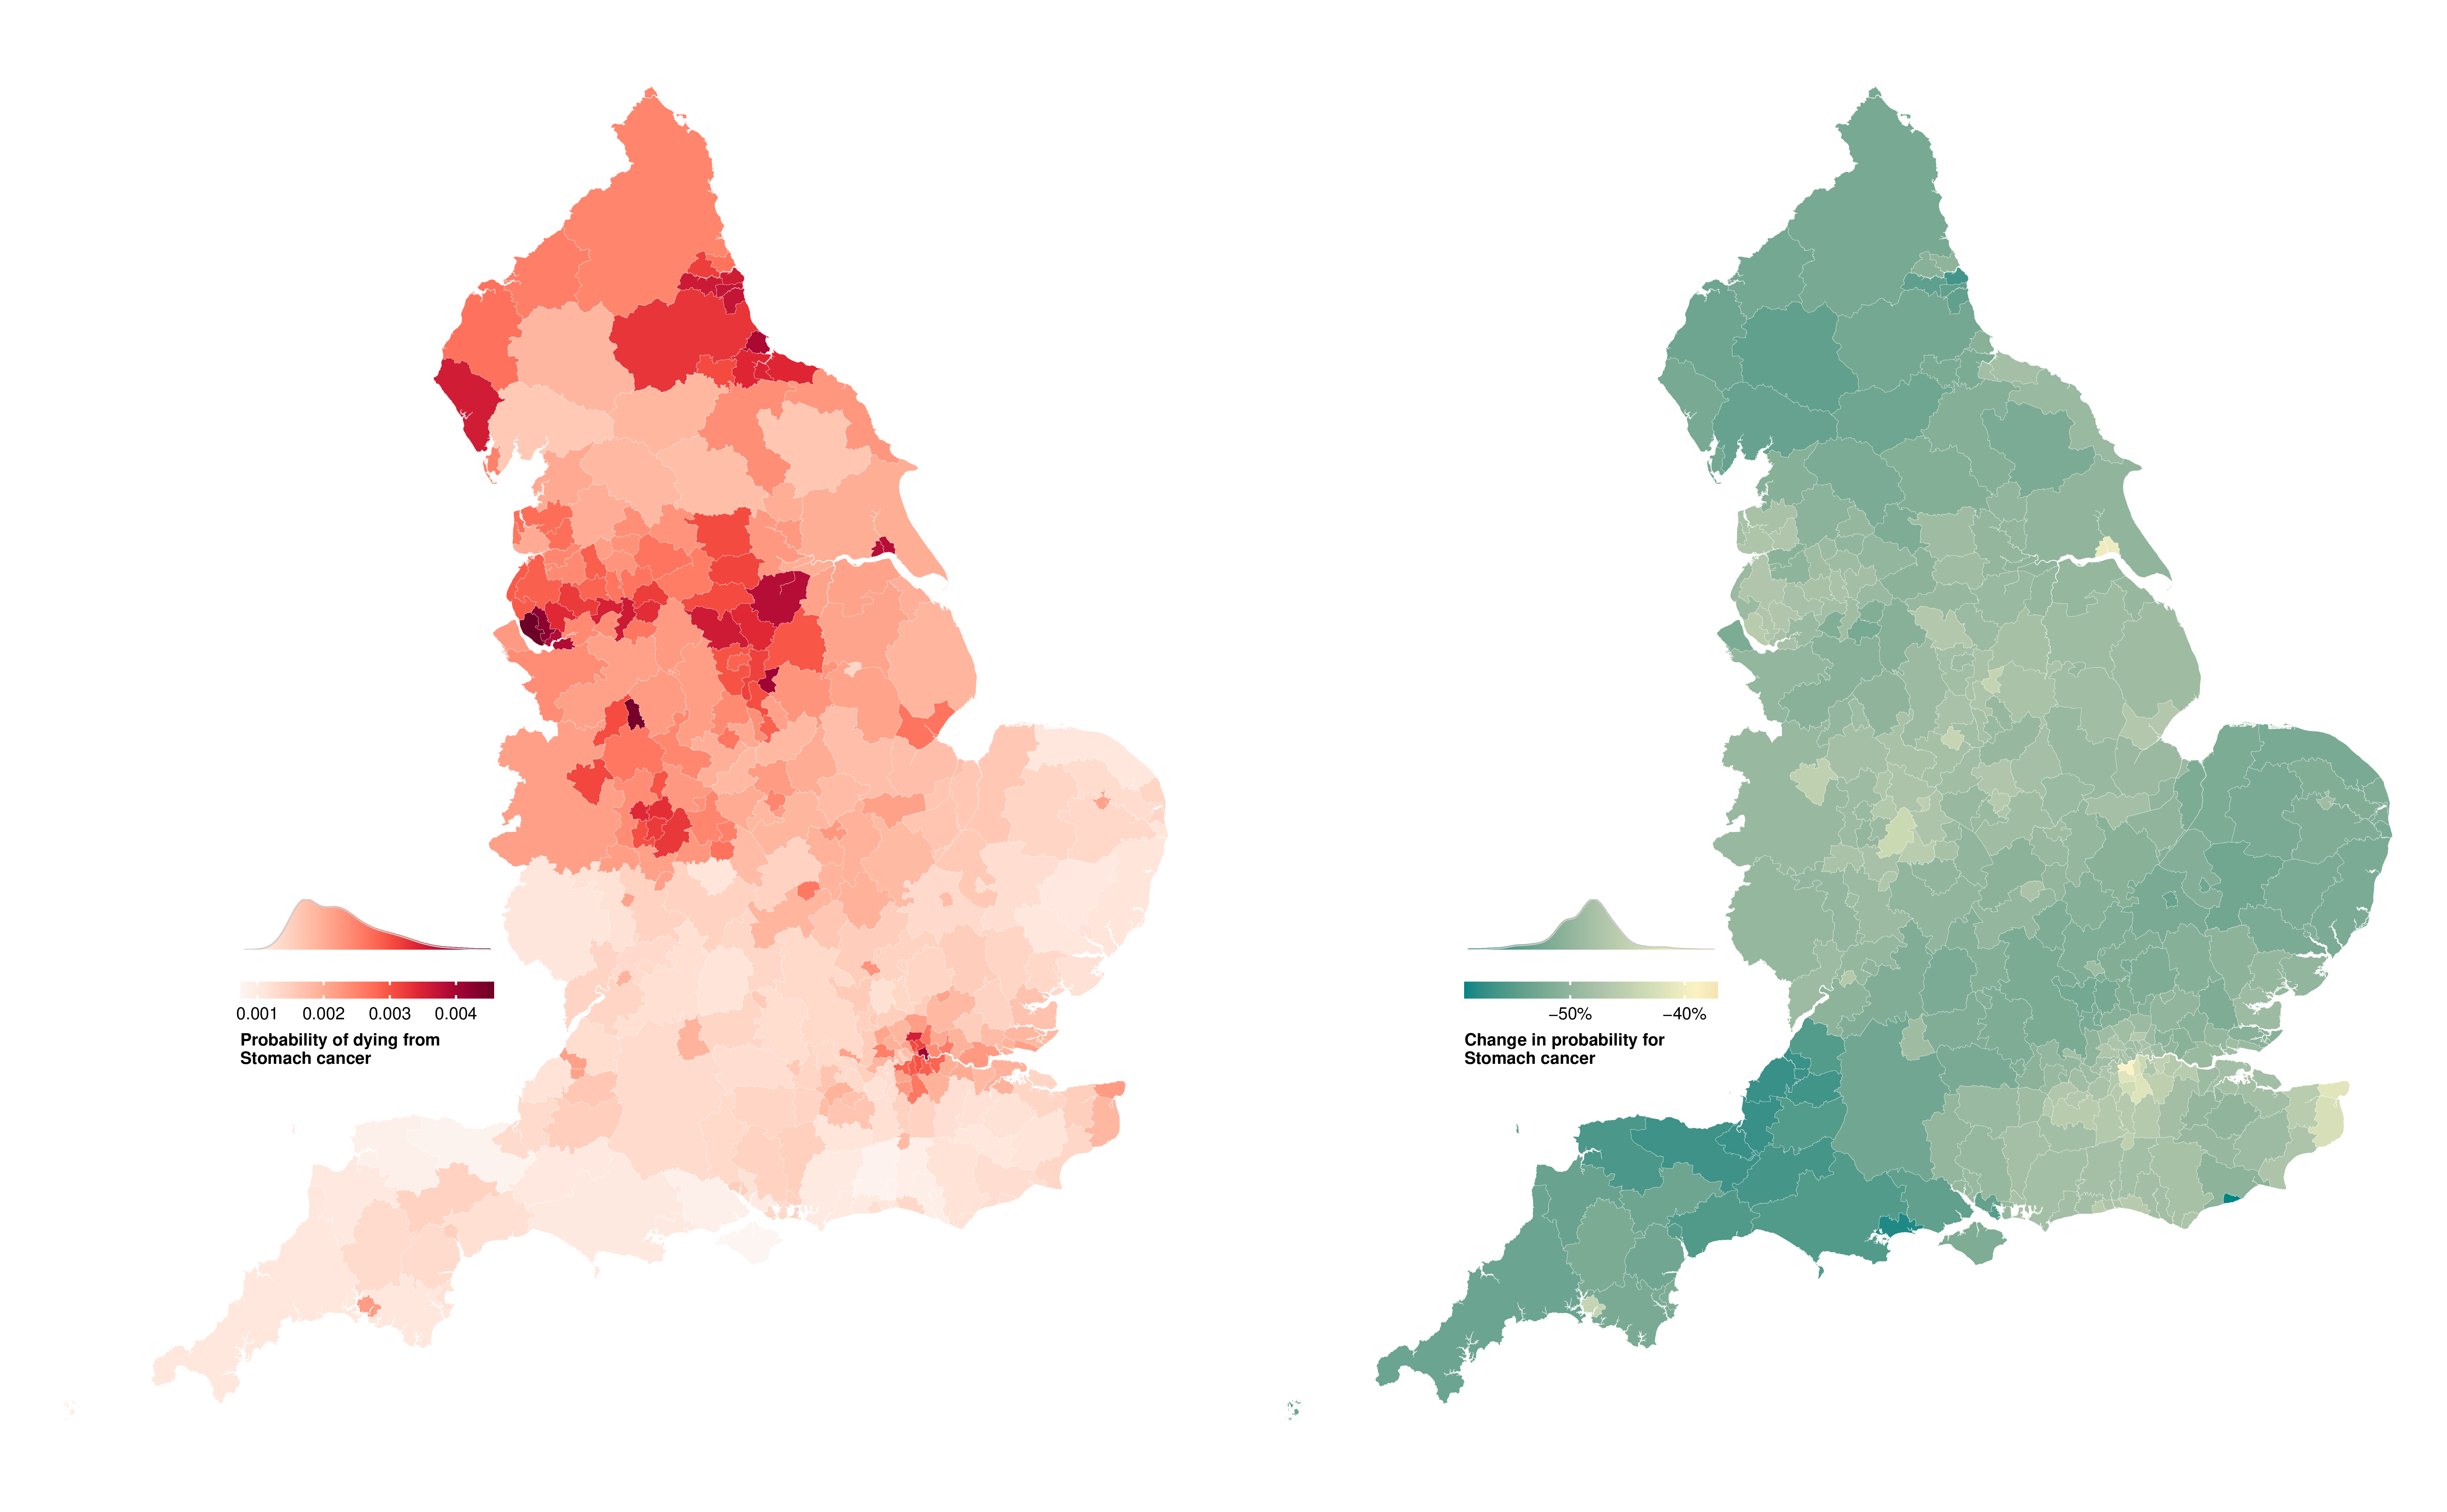
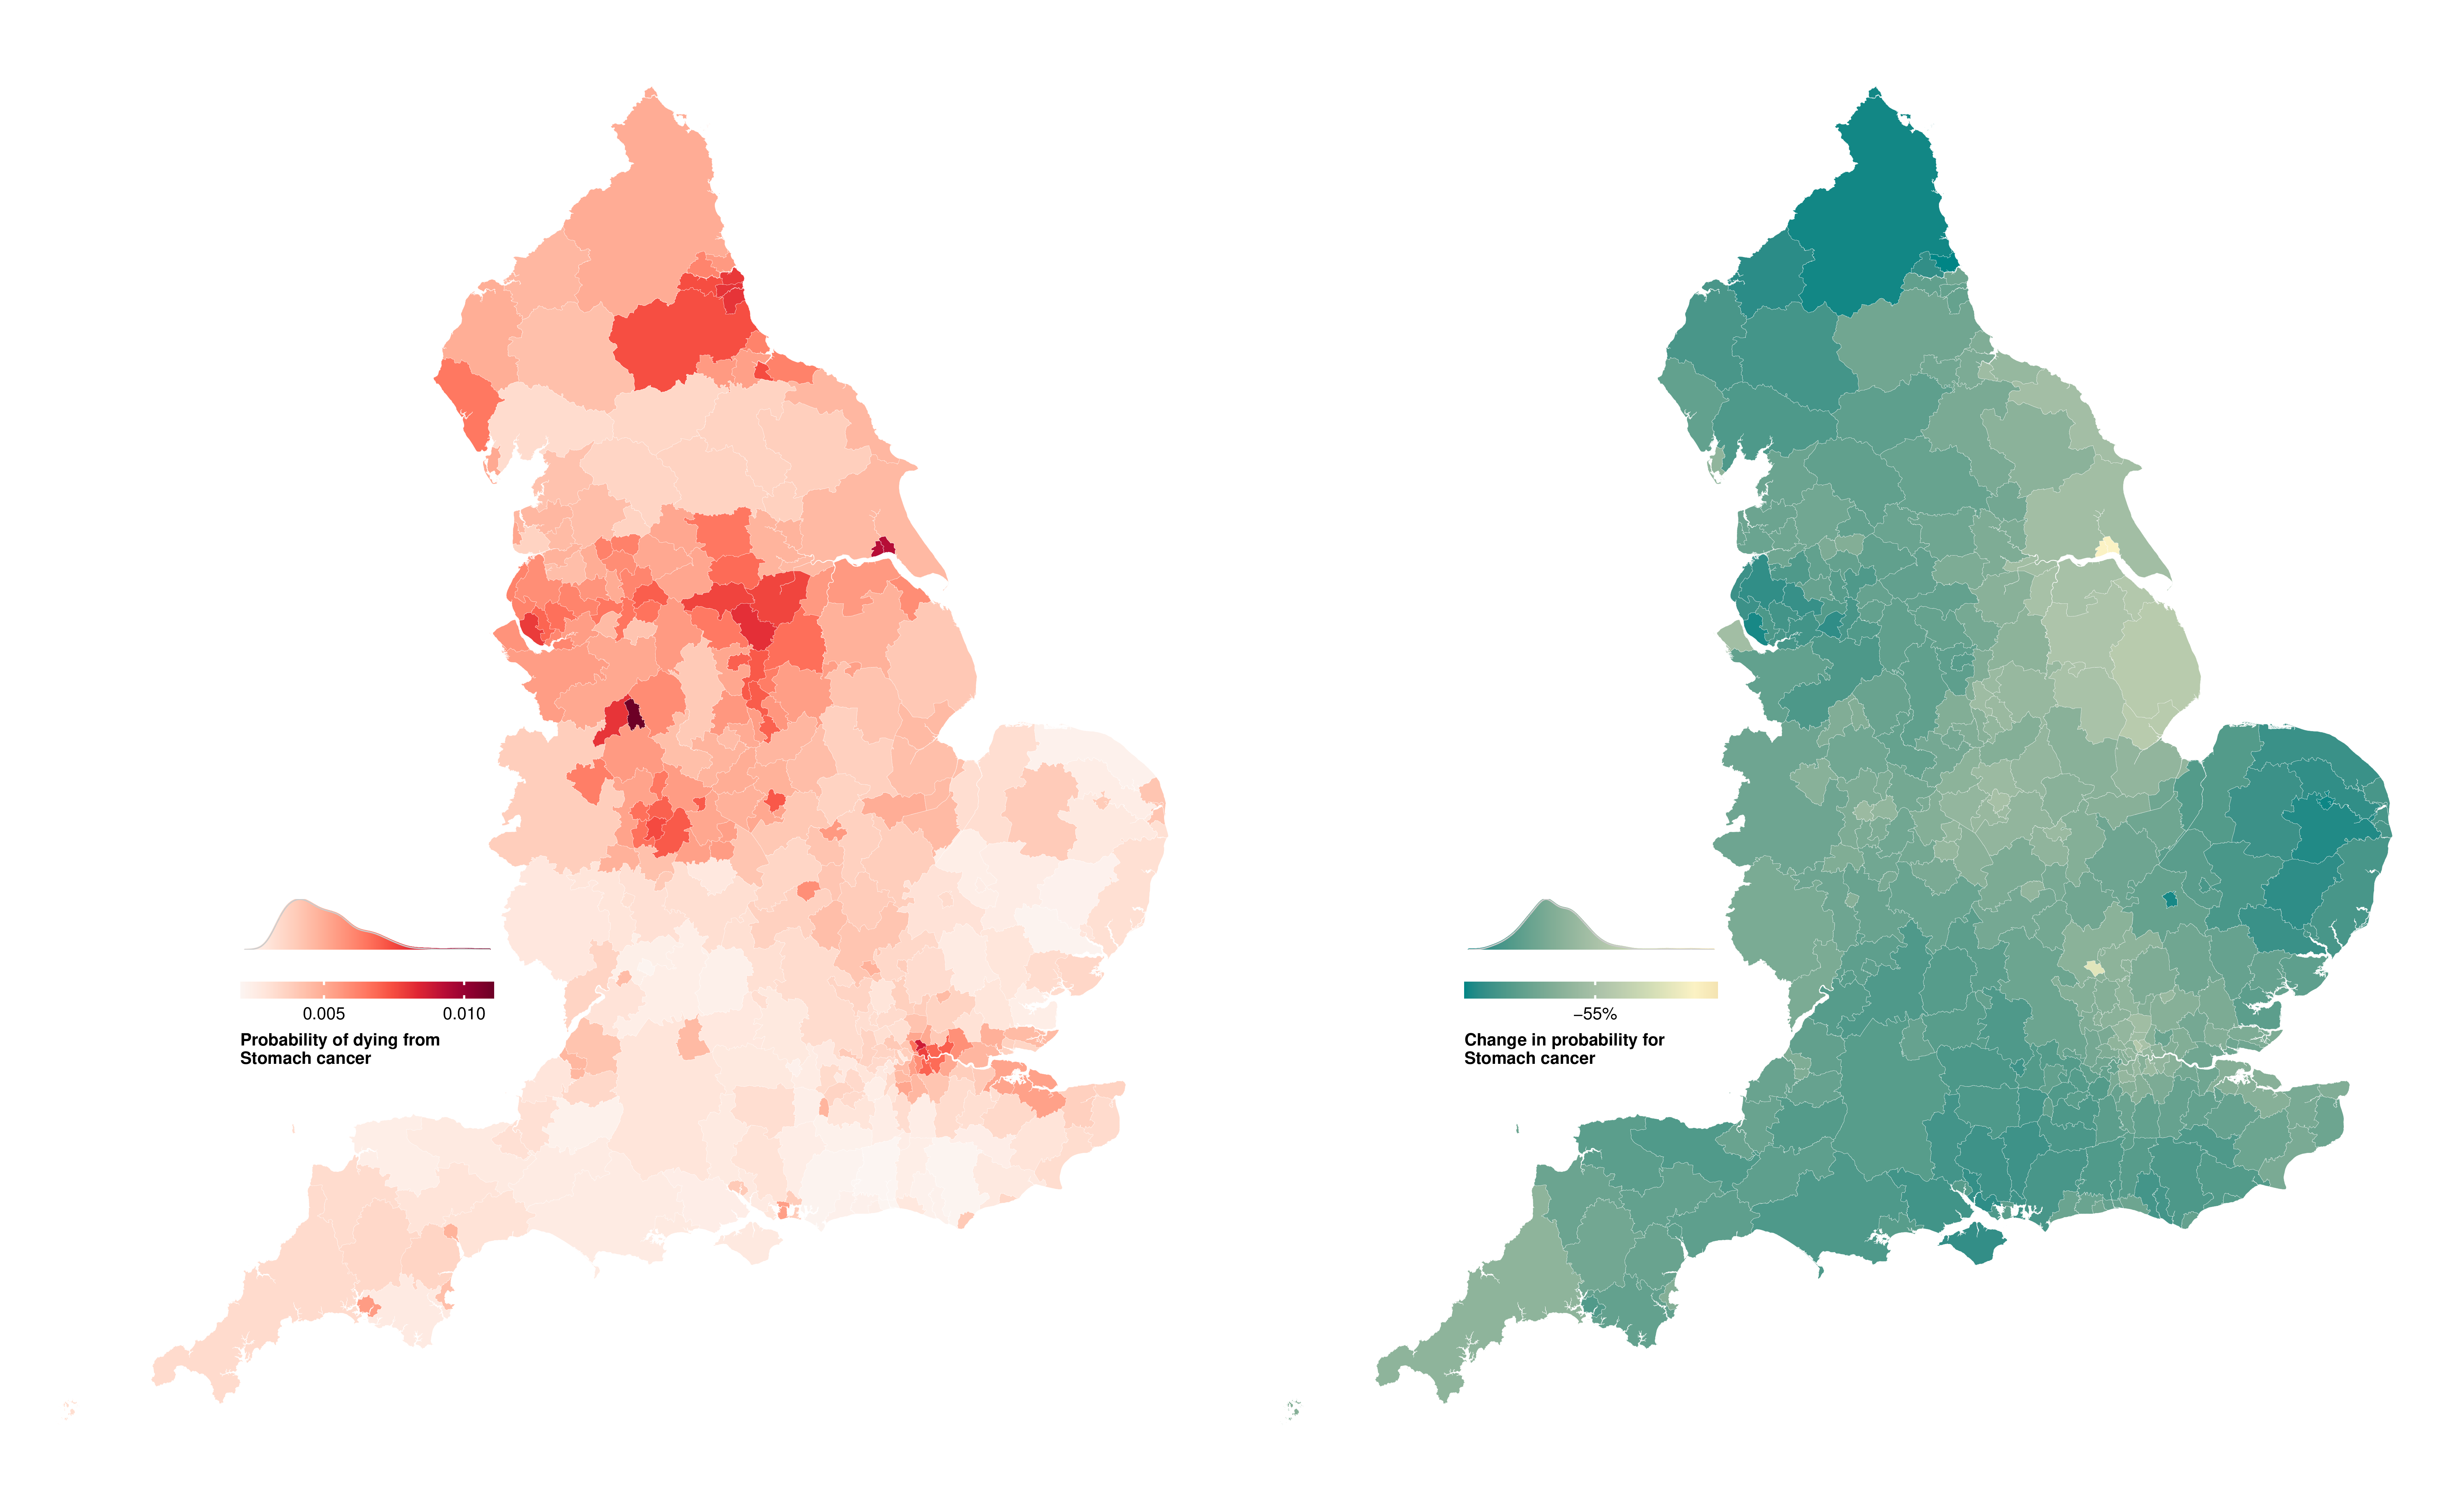
Figure E.13: Probability of dying from stomach cancer between birth and 80 years of age in 314 local authority districts in England in 2019 and change from 2002 to 2019.
(a) Women
(b) Men
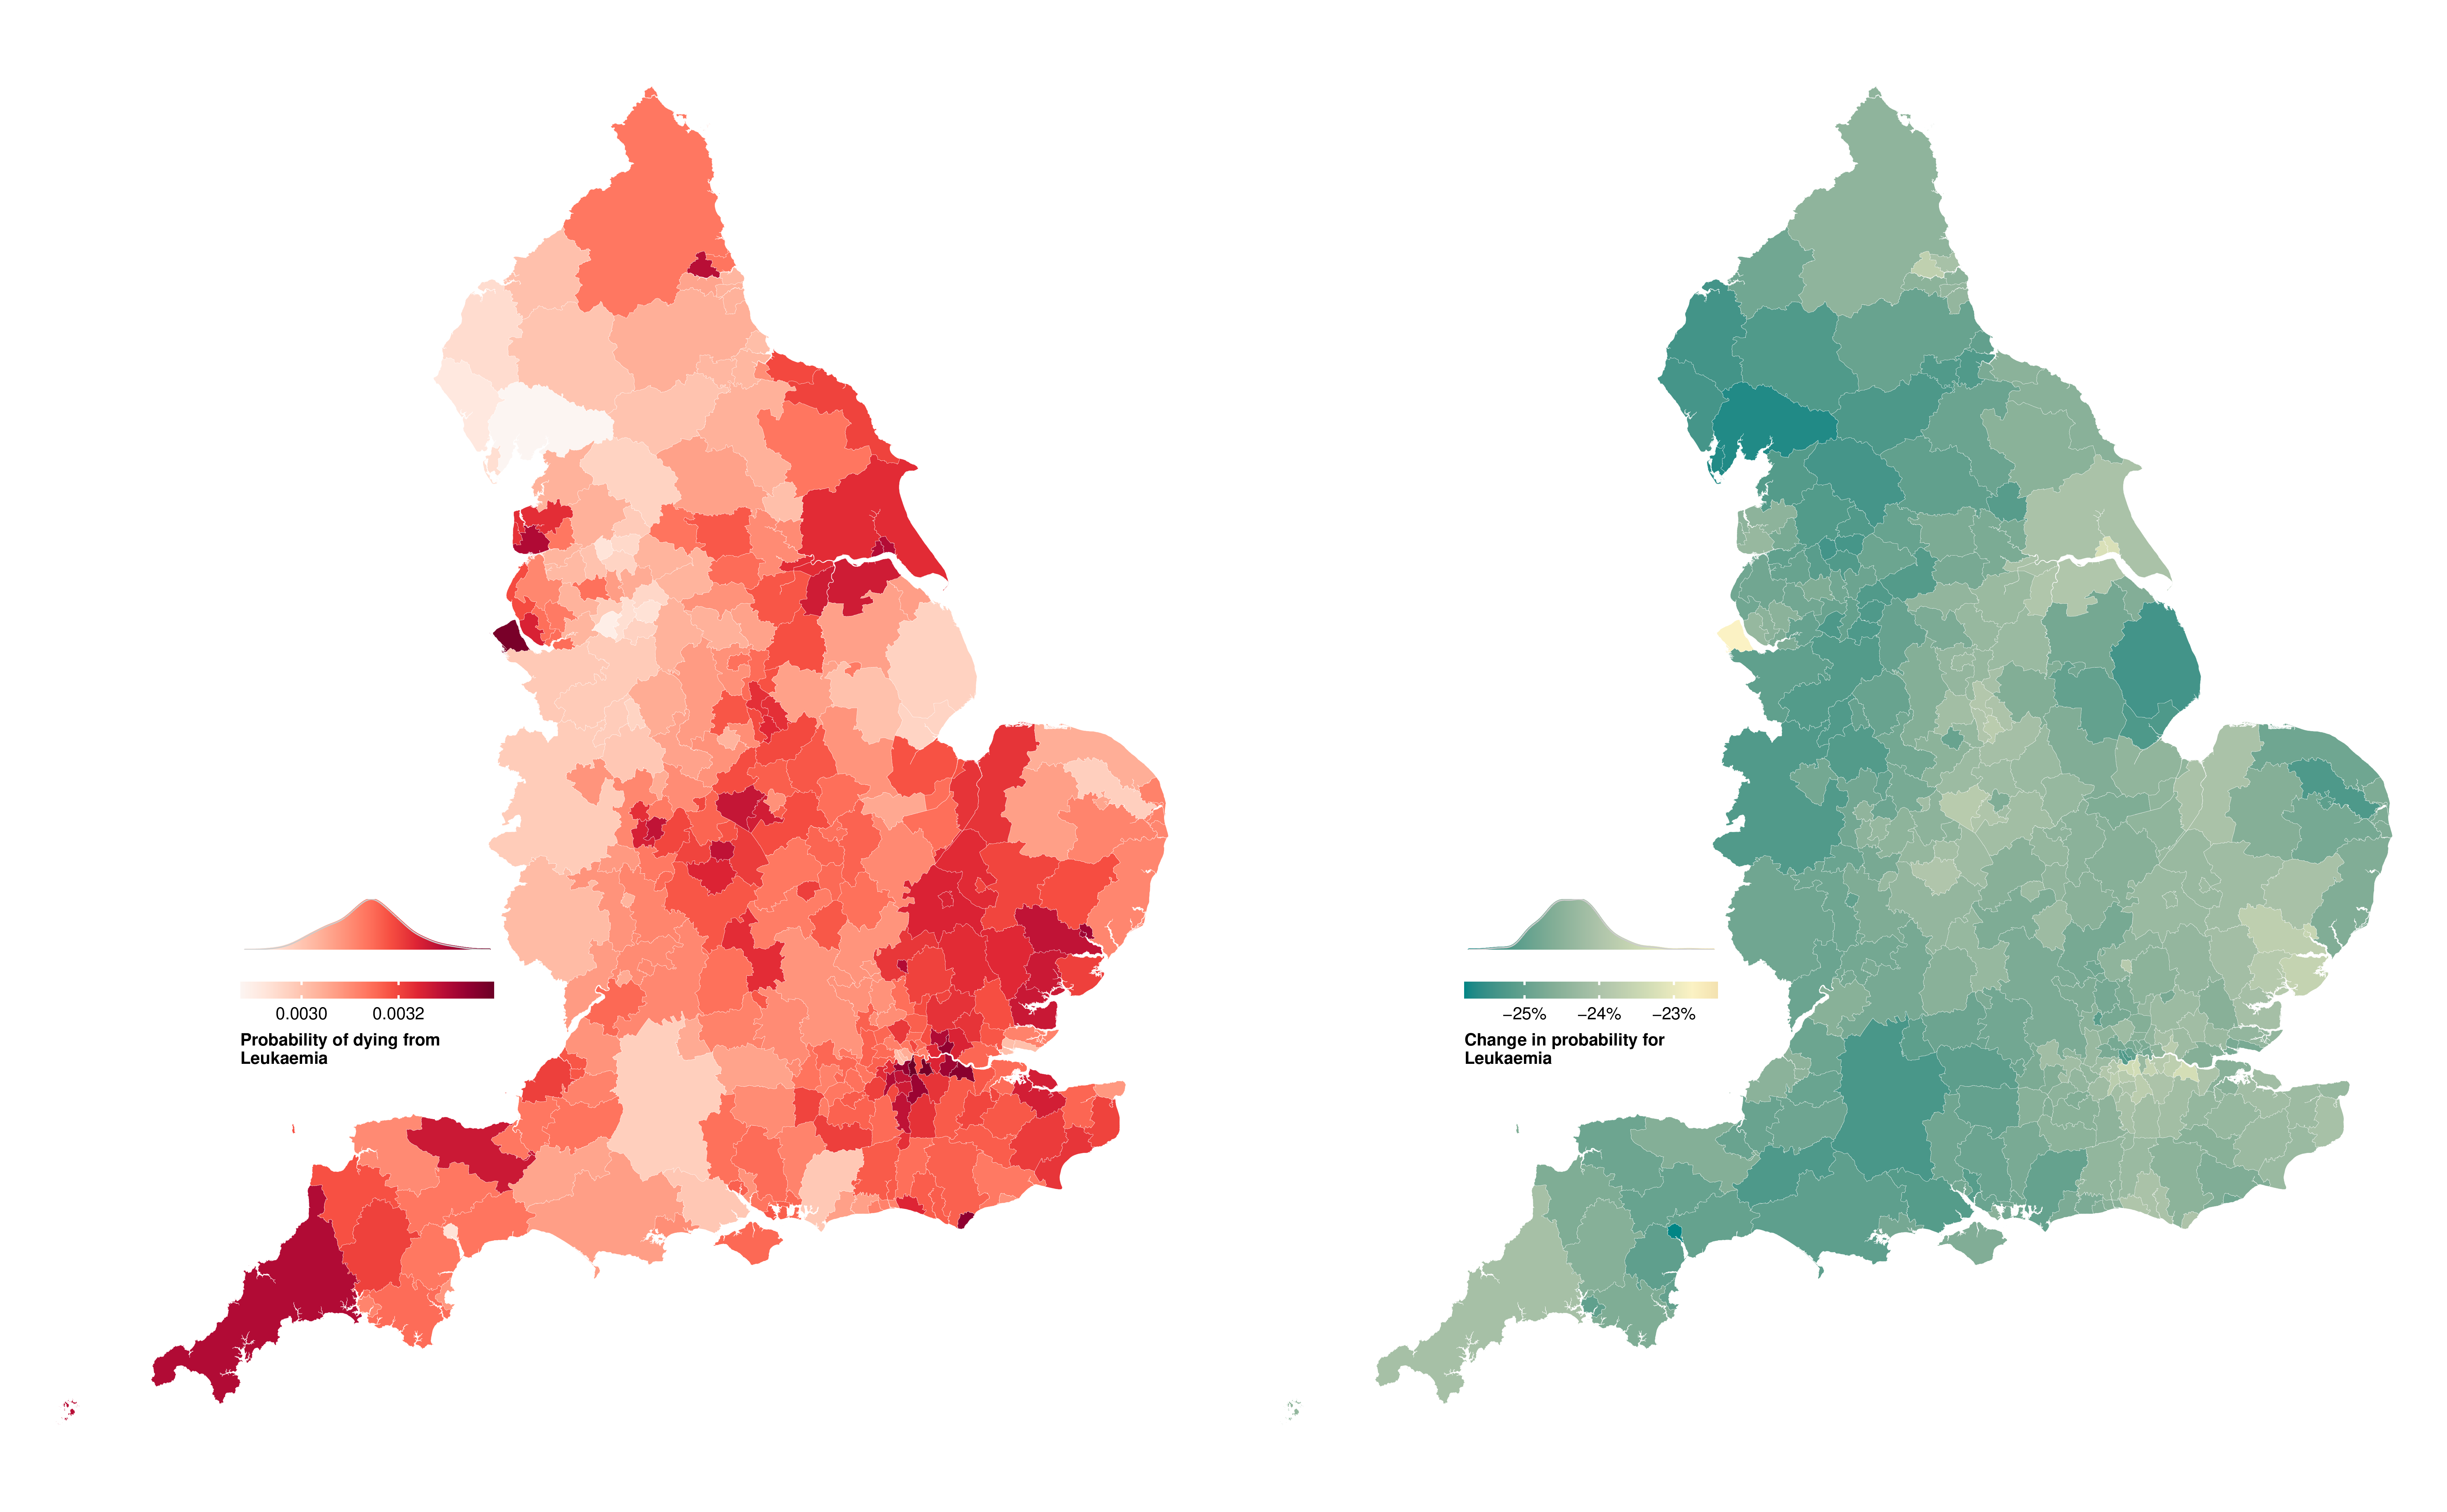
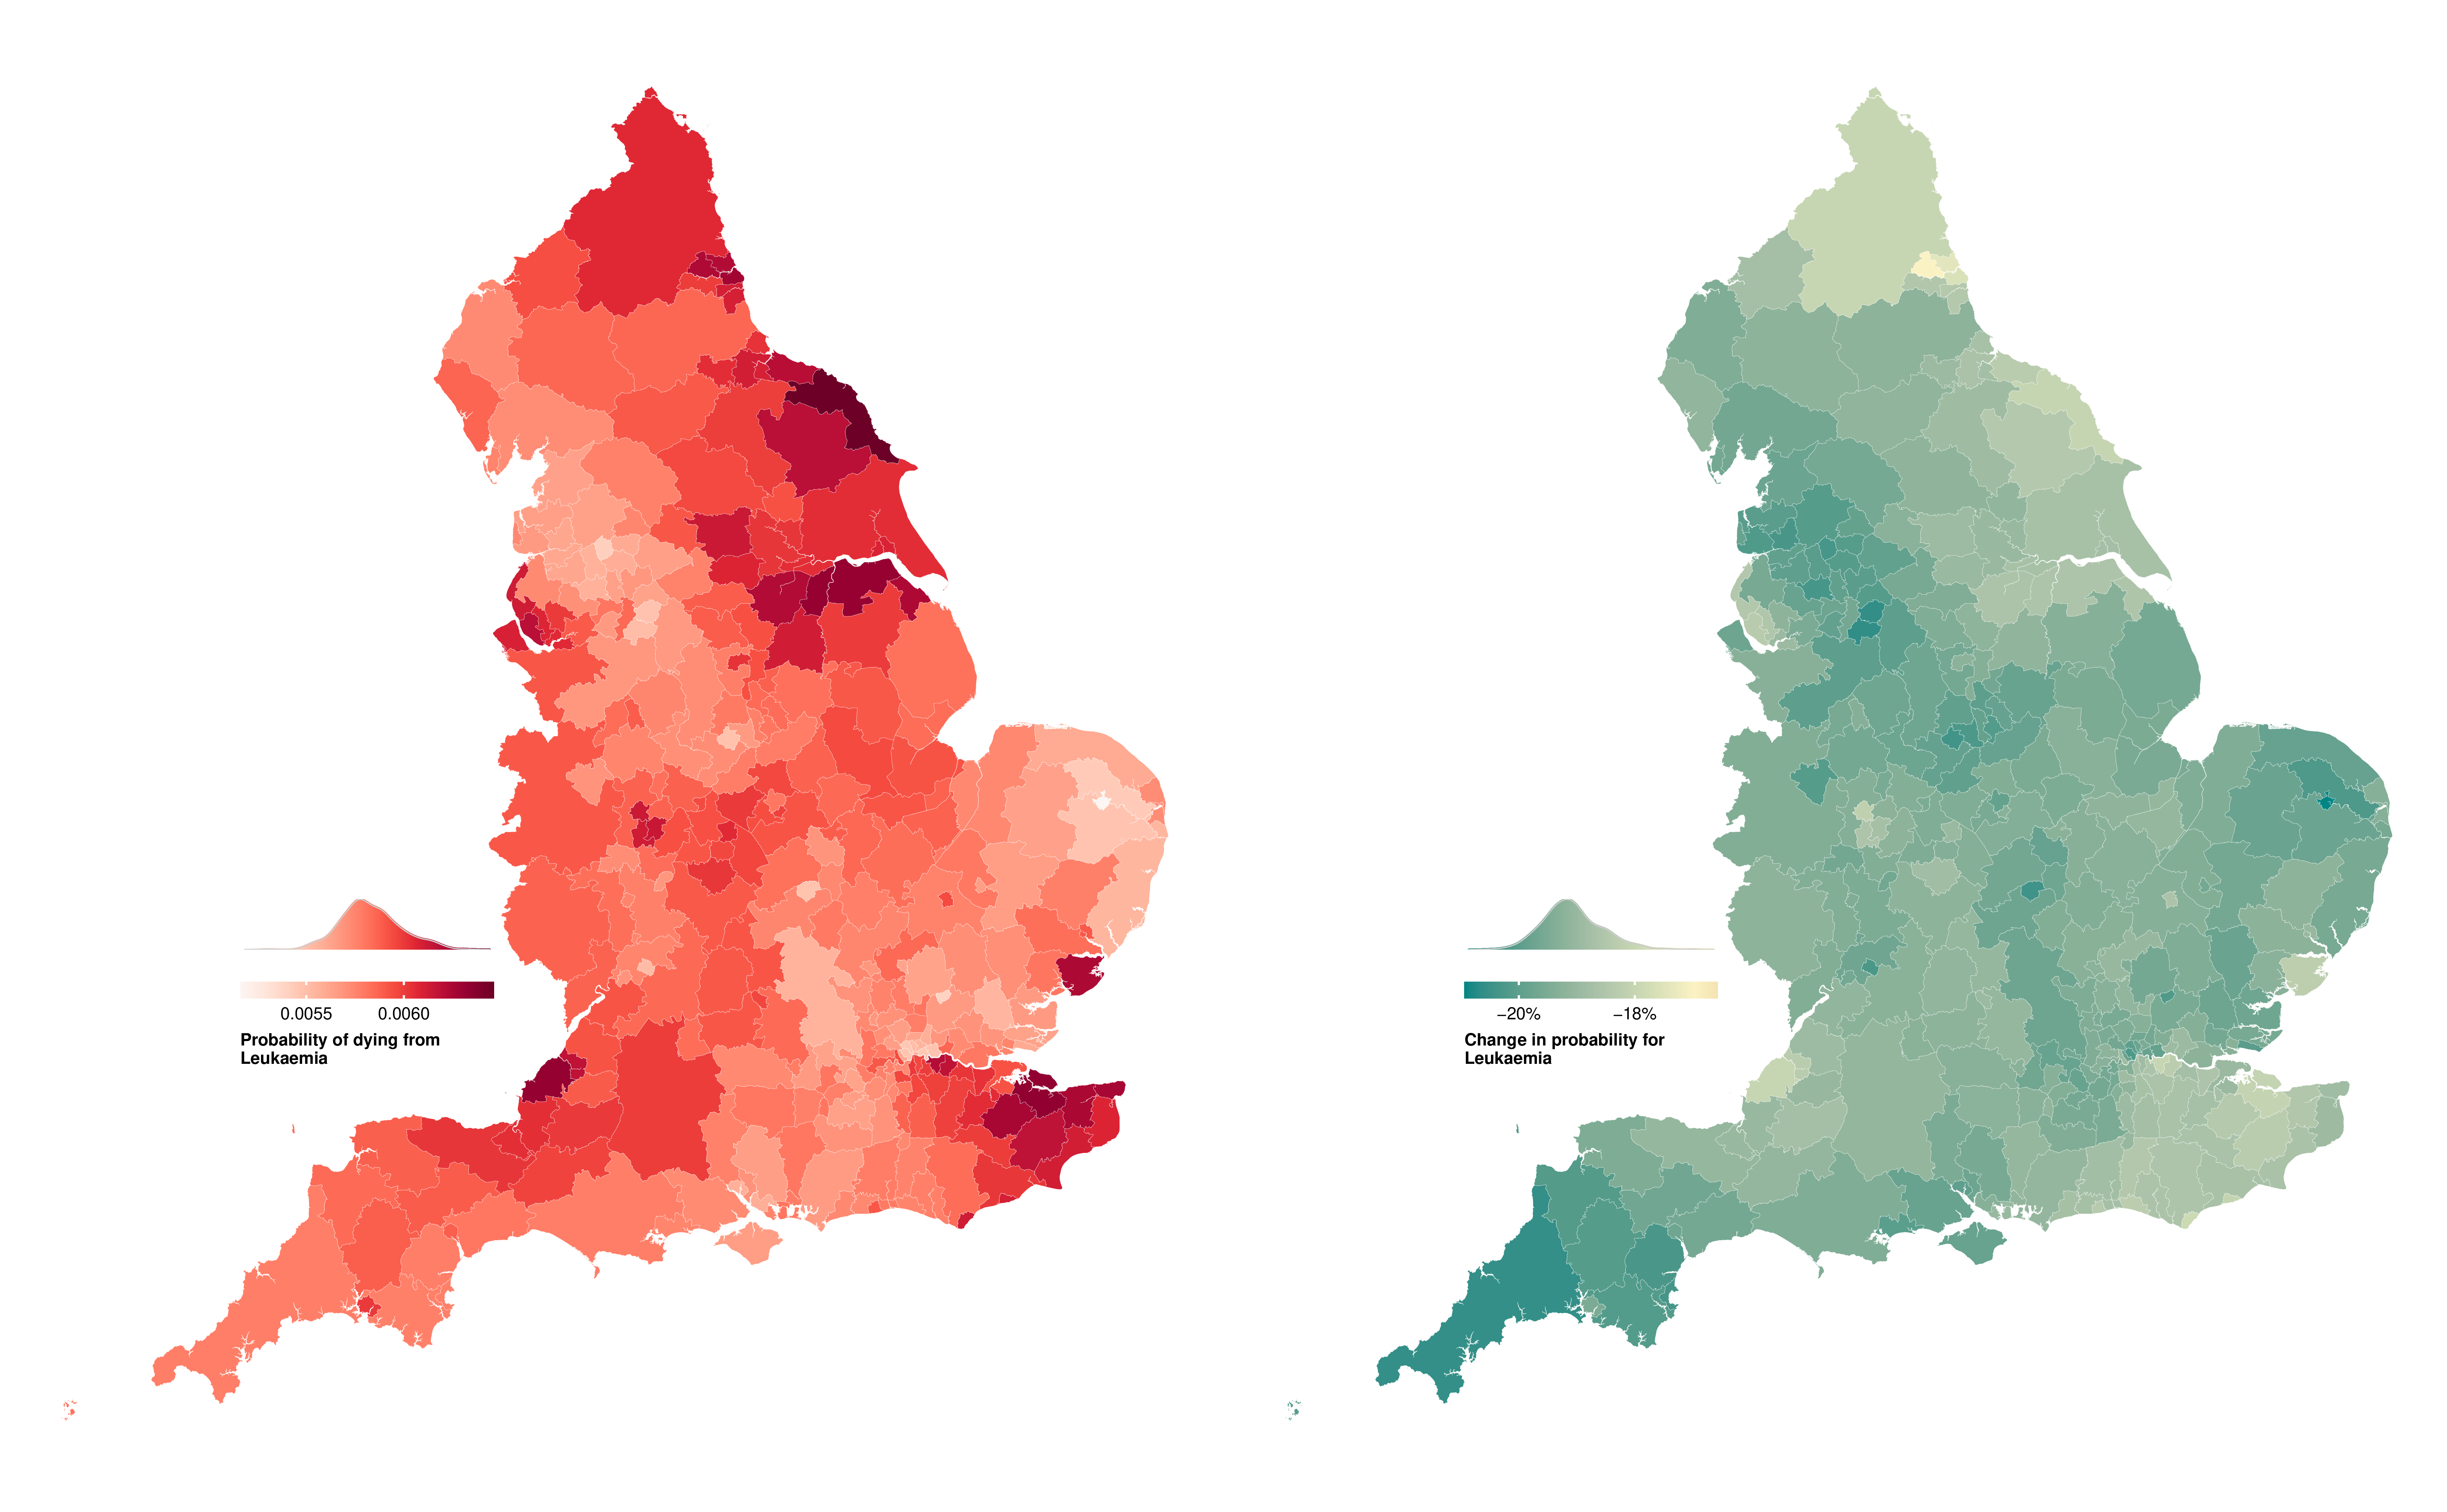
Figure E.14: Probability of dying from leukaemia between birth and 80 years of age in 314 local authority districts in England in 2019 and change from 2002 to 2019.
(a) Women
(b) Men
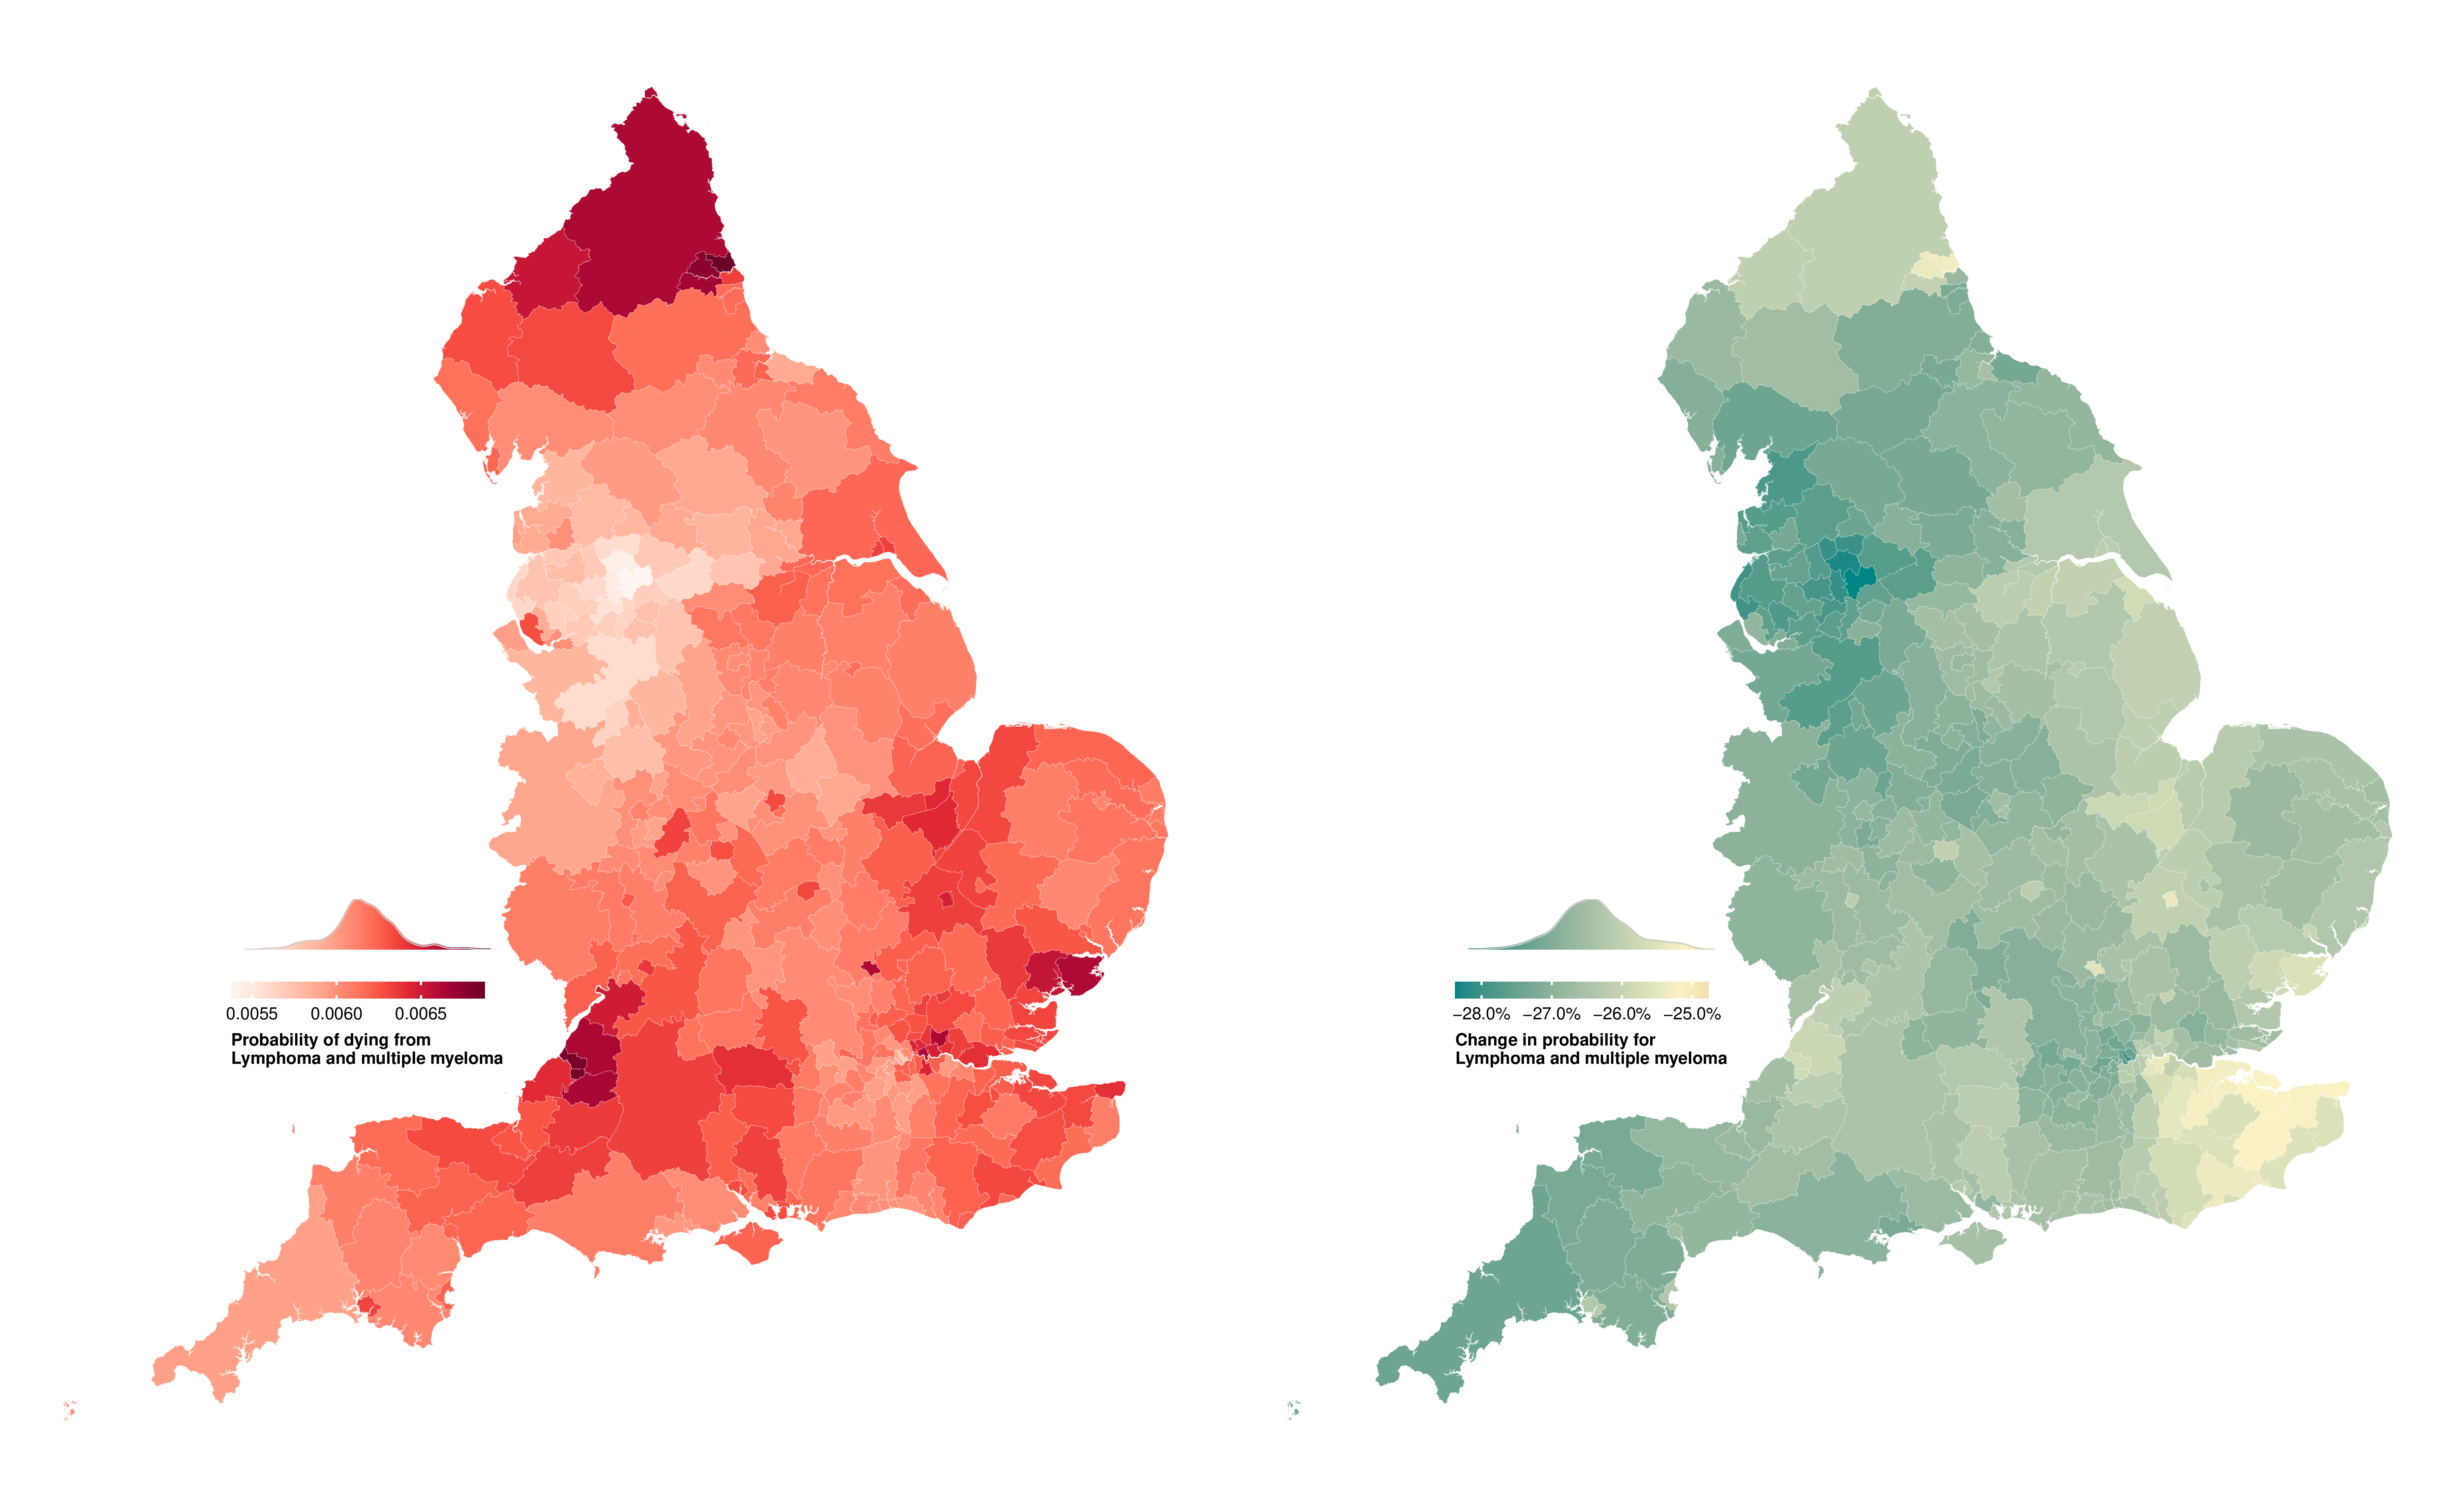
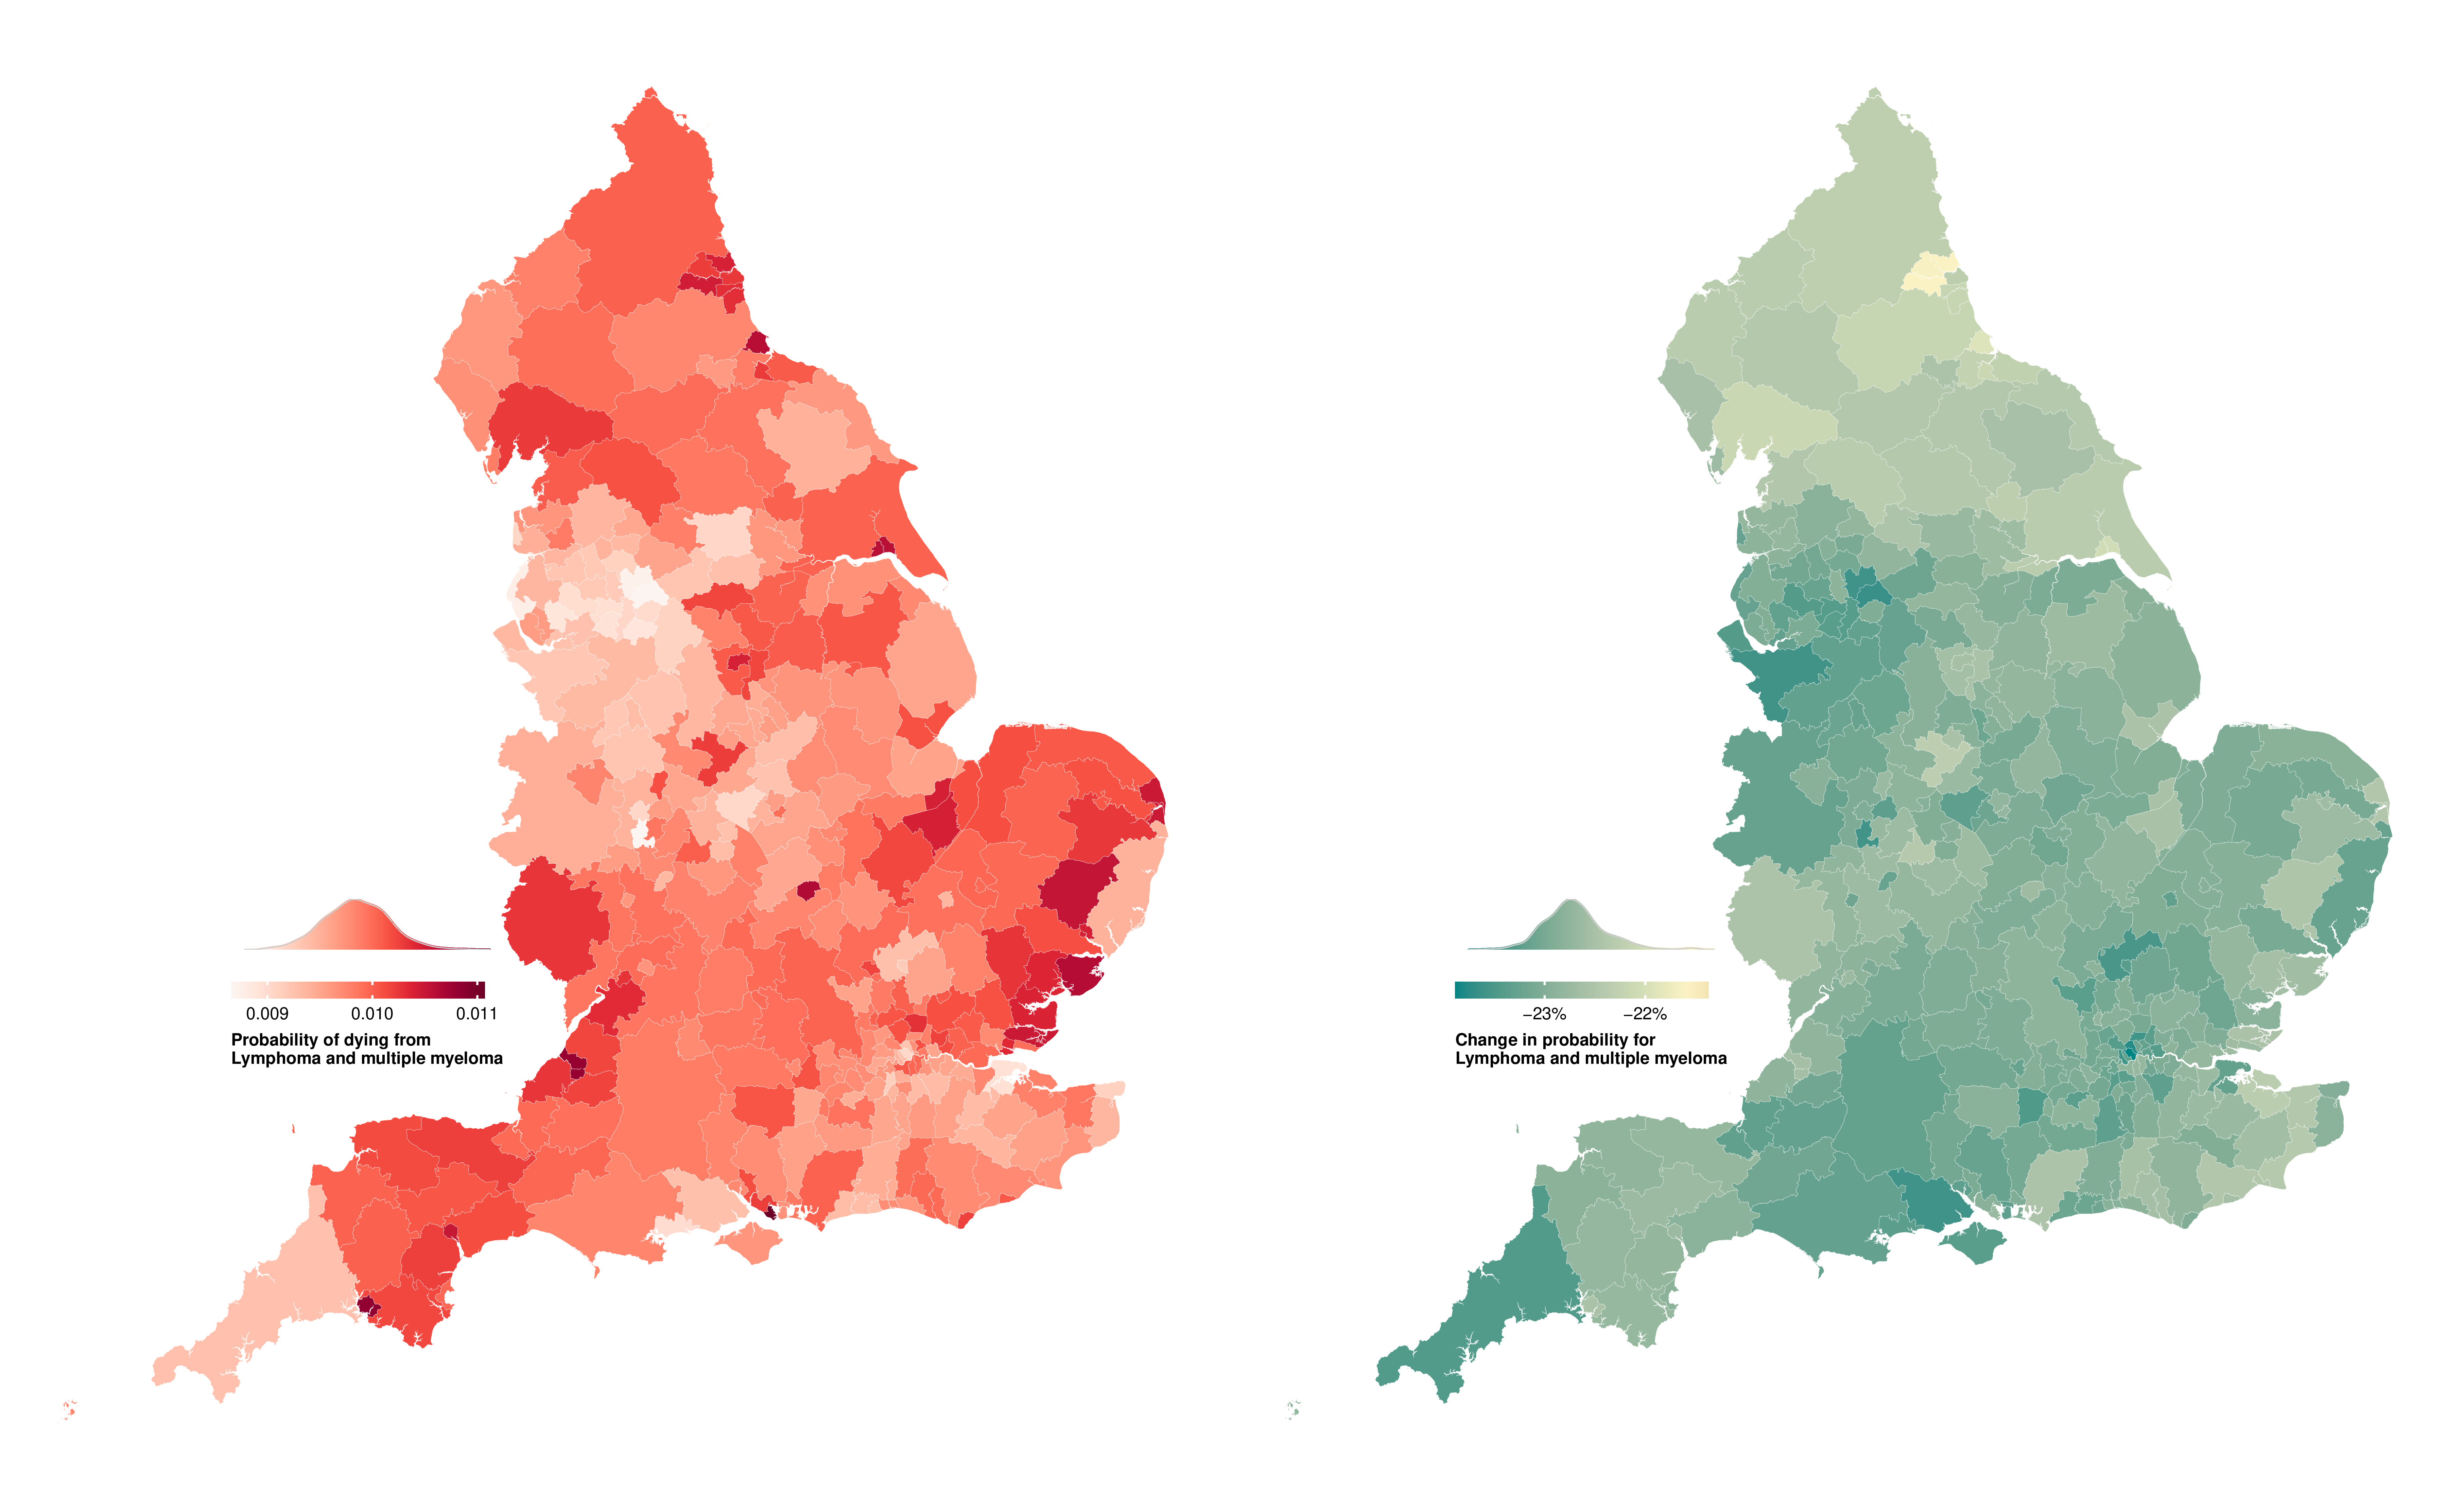
Figure E.15: Probability of dying from lymphoma and multiple myeloma between birth and 80 years of age in 314 local authority districts in England in 2019 and change from 2002 to 2019.
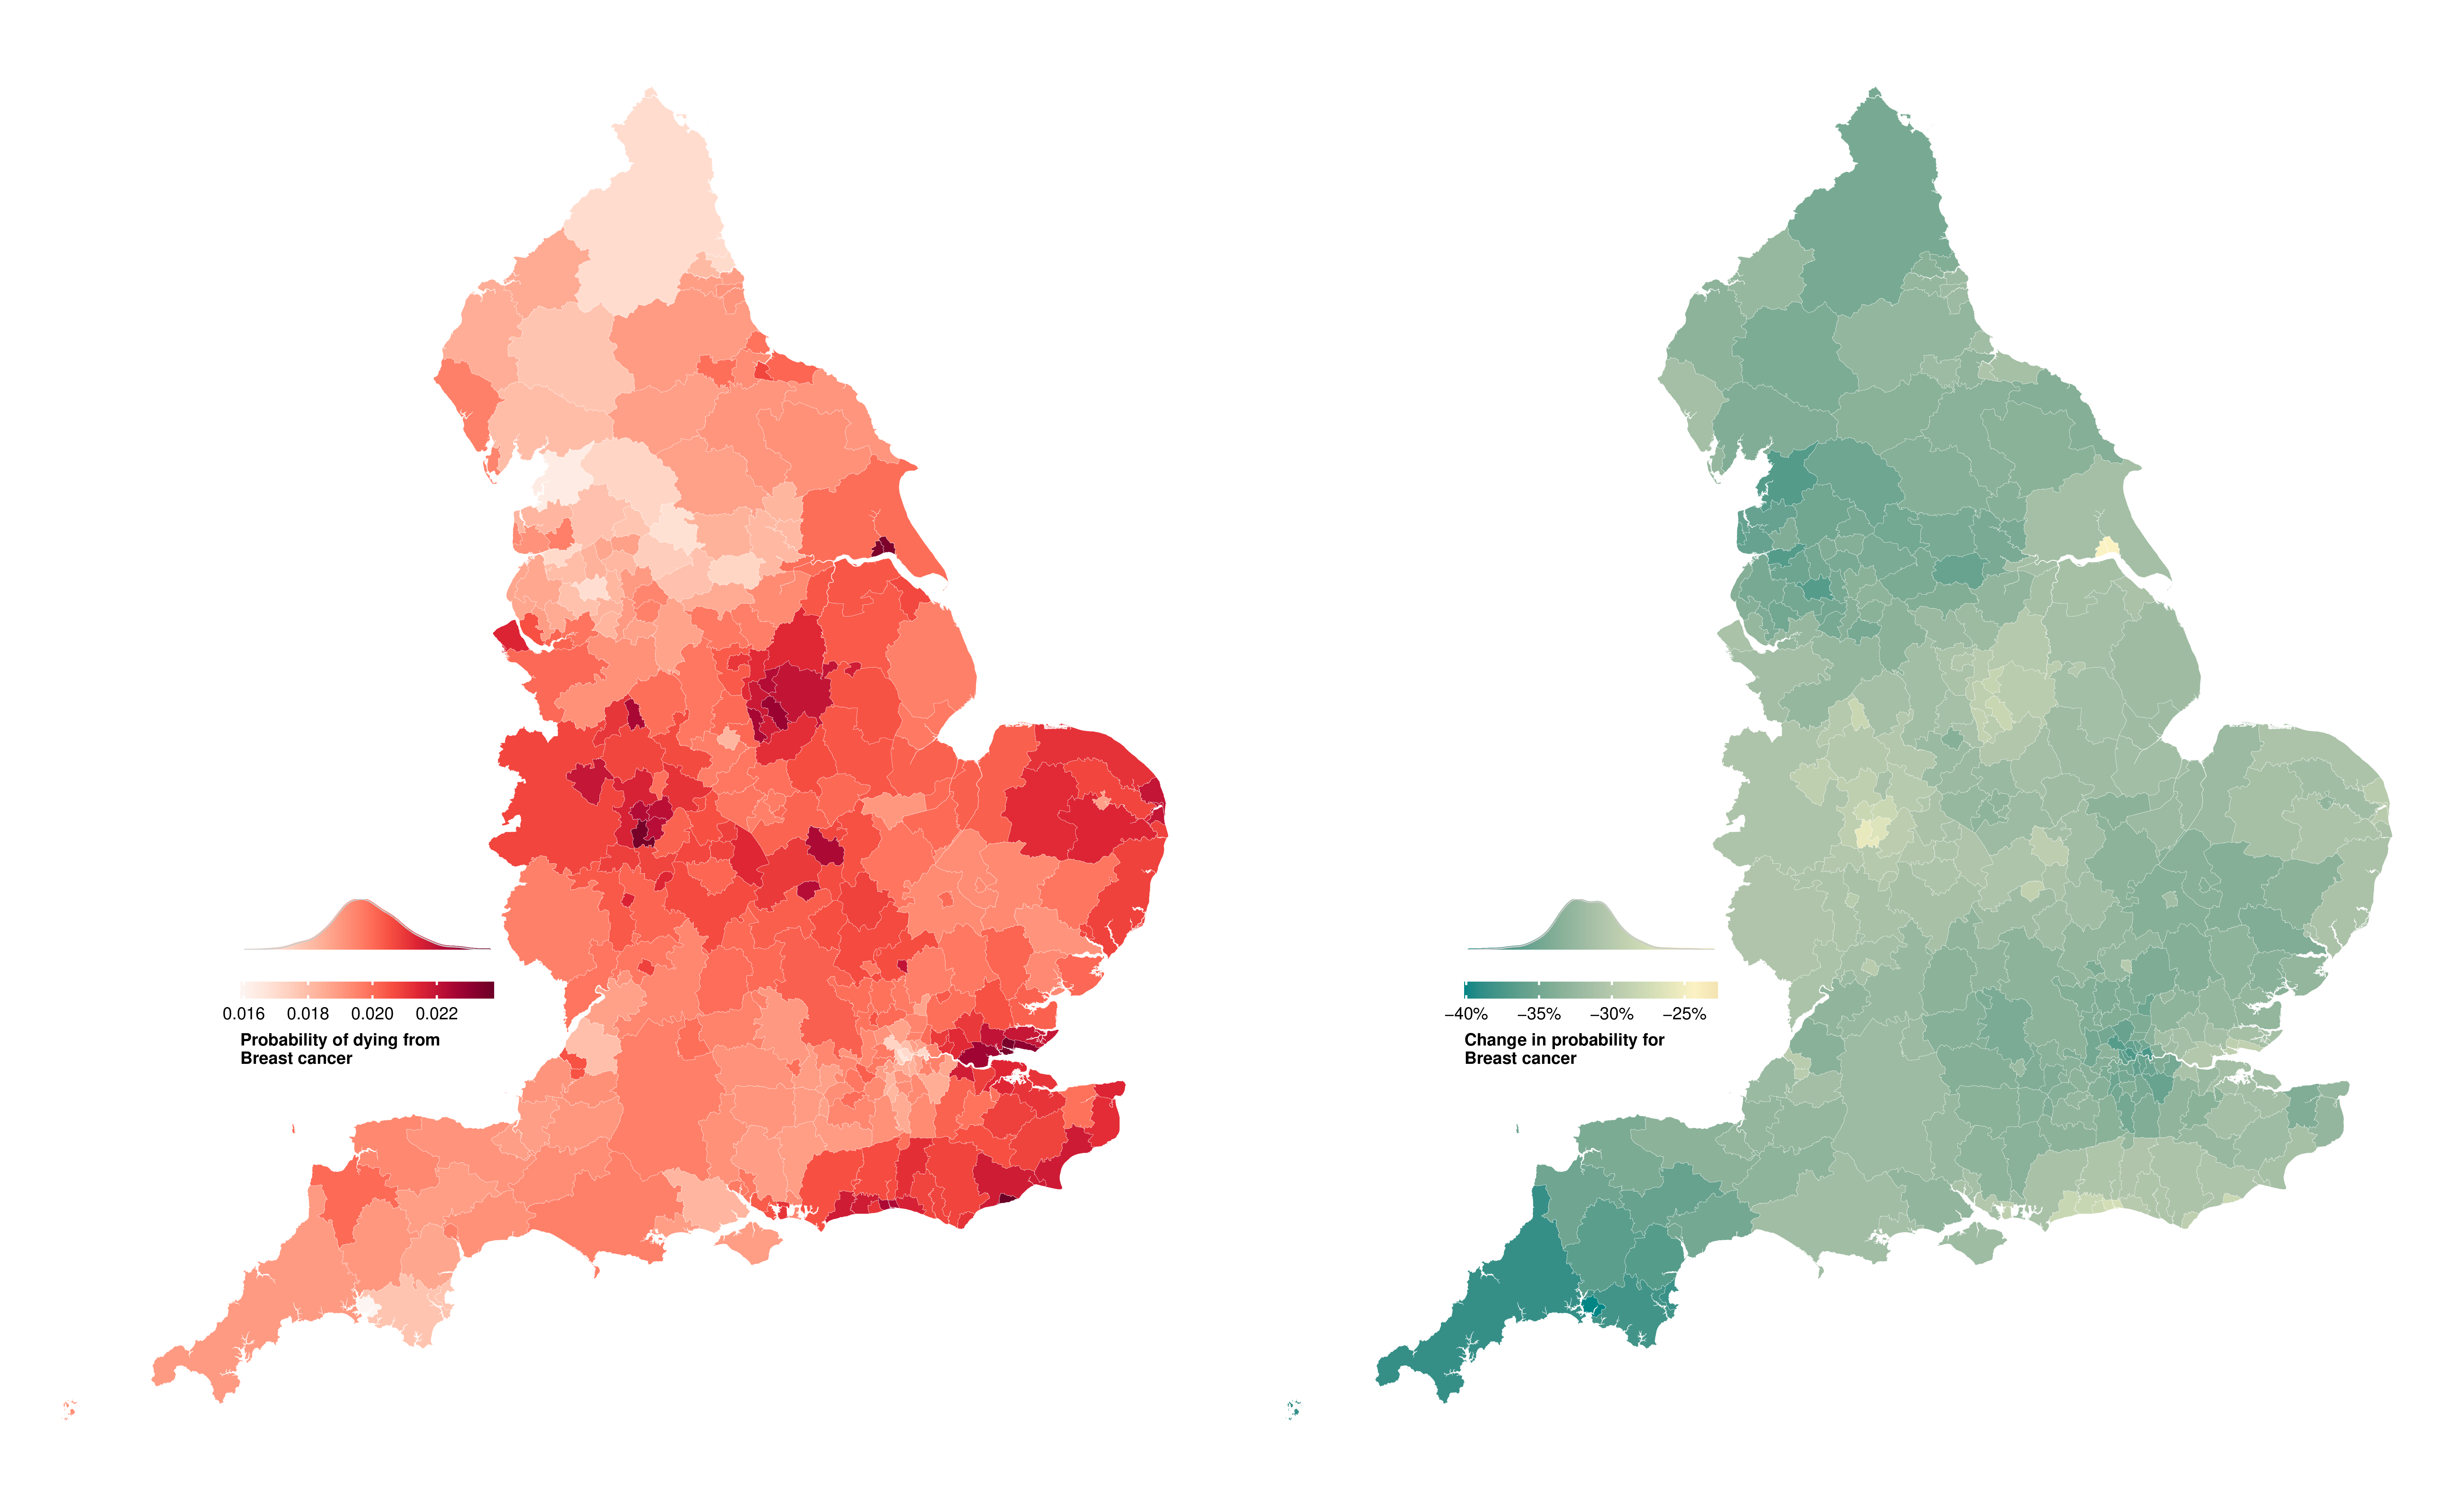
Figure E.16: Probability of dying for women from breast cancer between birth and 80 years of age in 314 local authority districts in England in 2019 and change from 2002 to 2019.
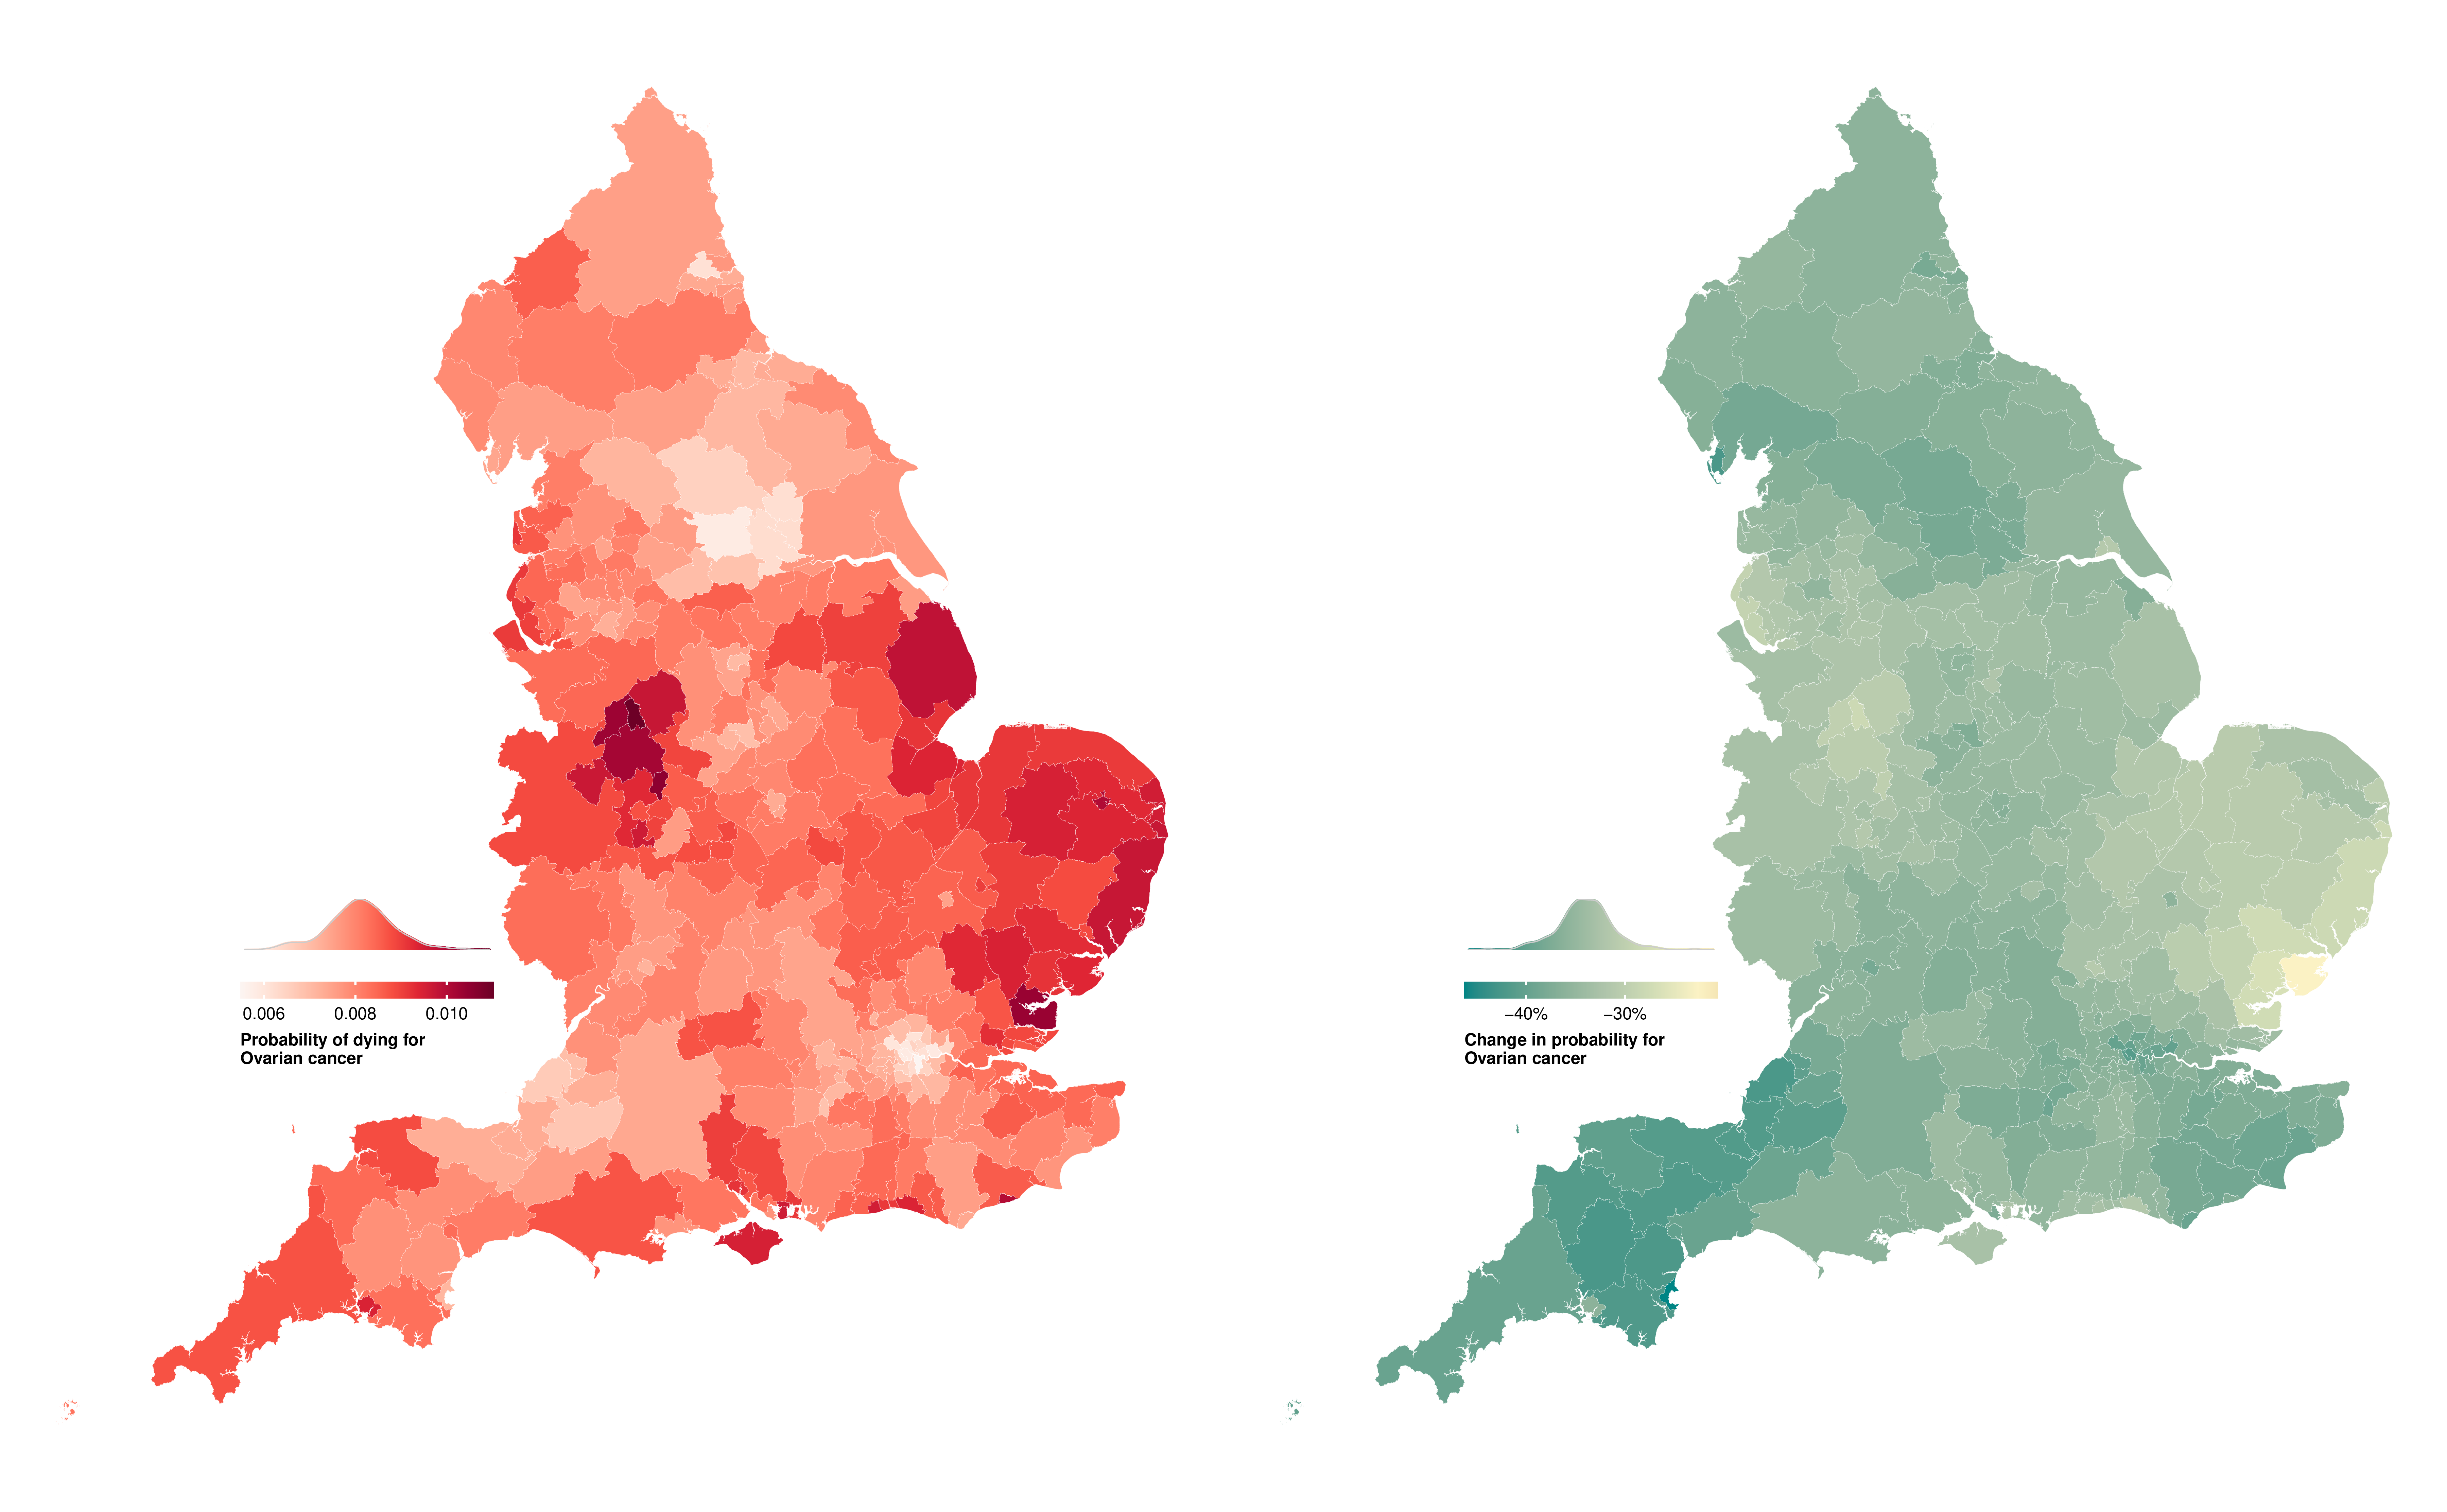
Figure E.17: Probability of dying for women from ovarian cancer between birth and 80 years of age in 314 local authority districts in England in 2019 and change from 2002 to 2019.
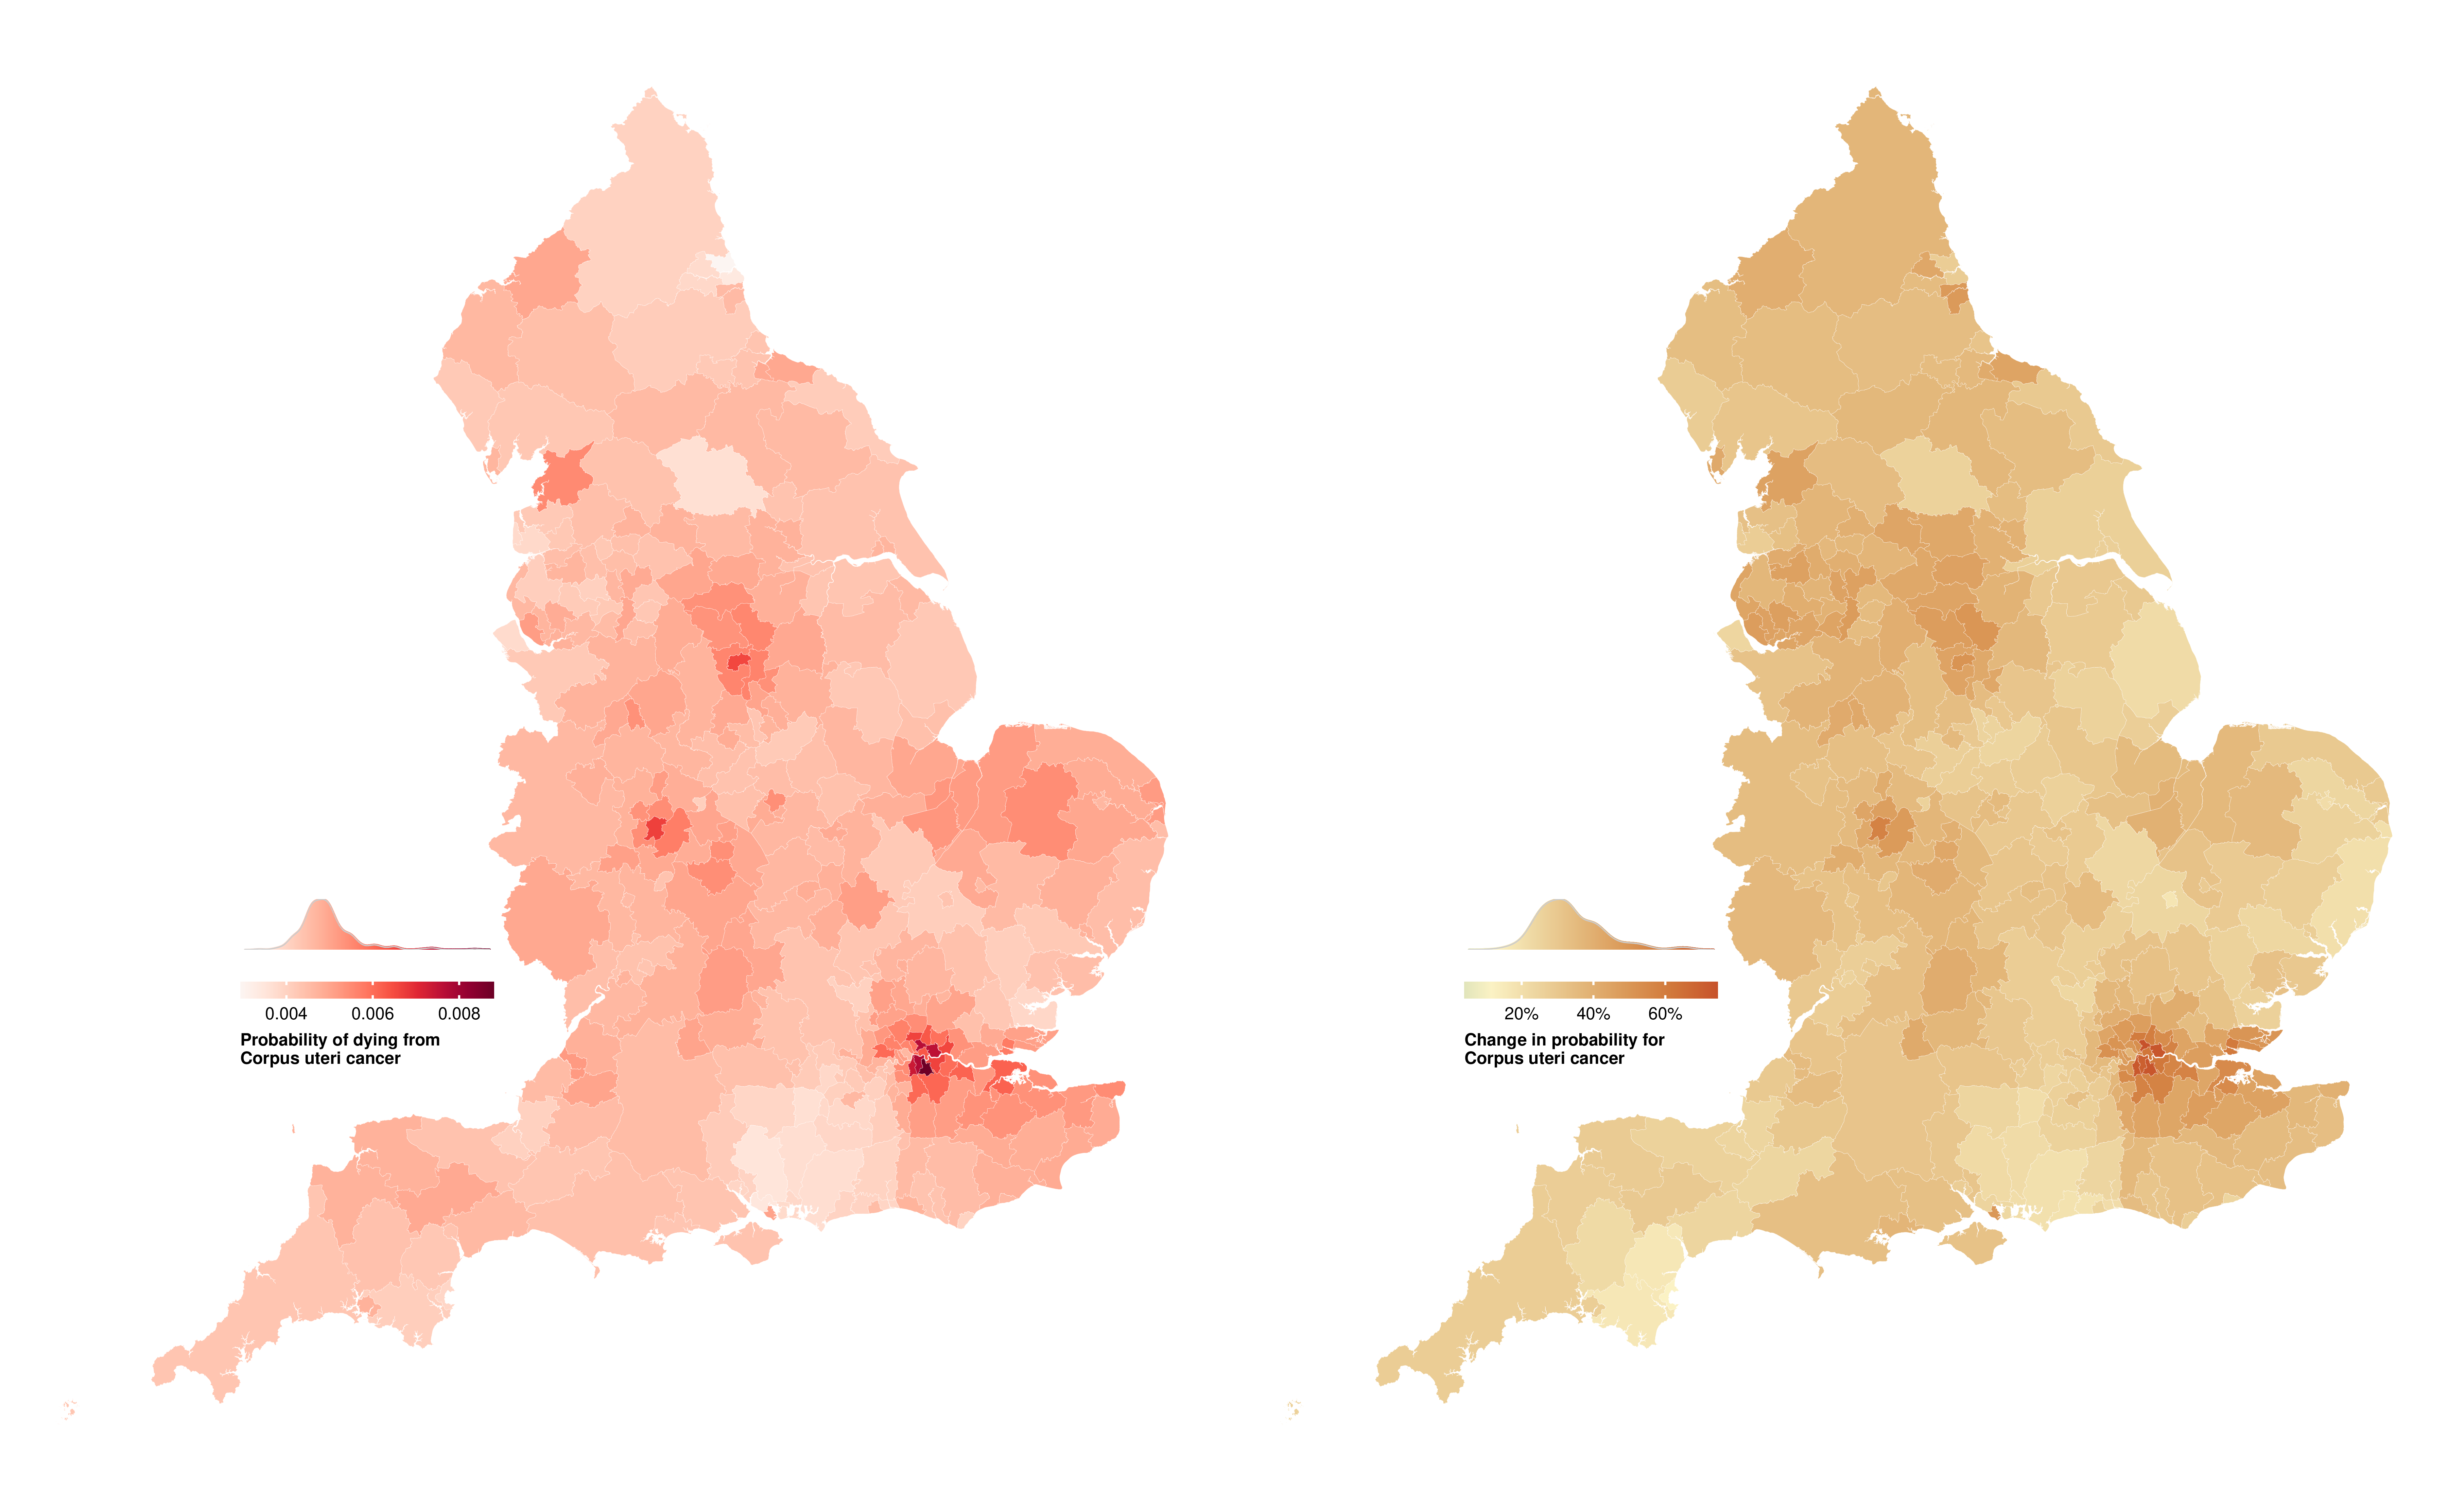
Figure E.18: Probability of dying for women from corpus uteri cancer between birth and 80 years of age in 314 local authority districts in England in 2019 and change from 2002 to 2019.
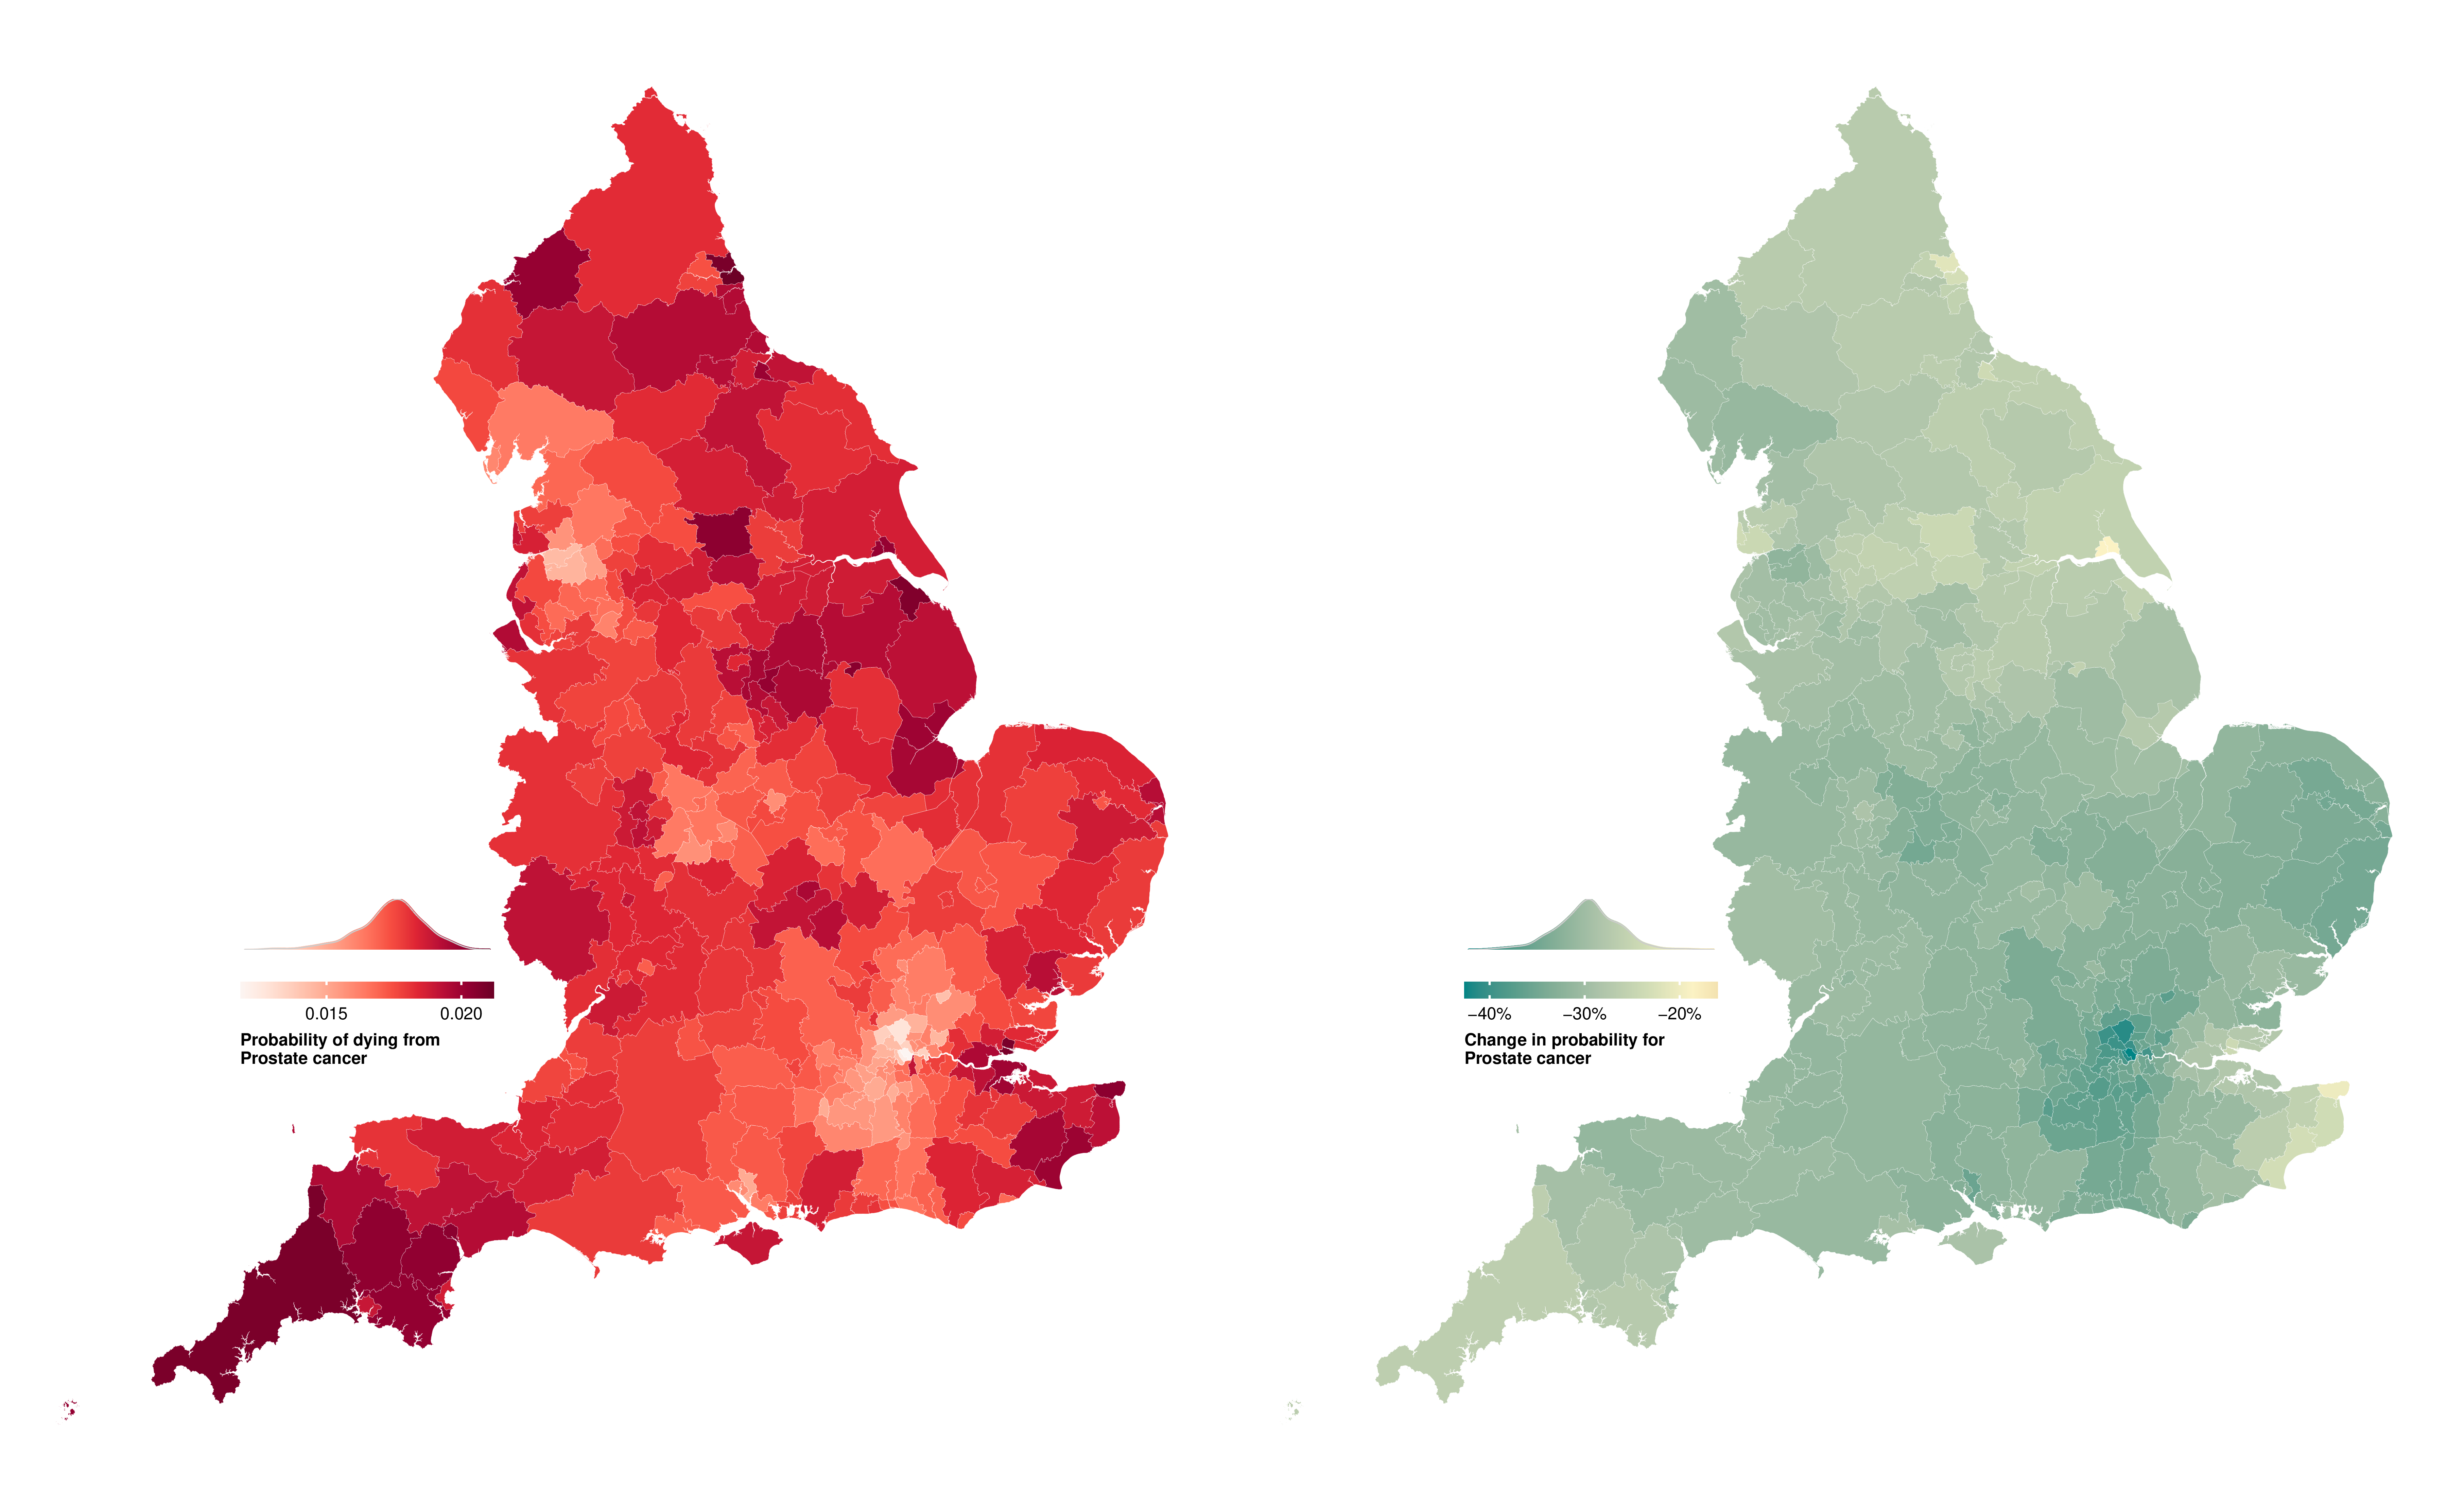
Figure E.19: Probability of dying for men from prostate cancer between birth and 80 years of age in 314 local authority districts in England in 2019 and change from 2002 to 2019.
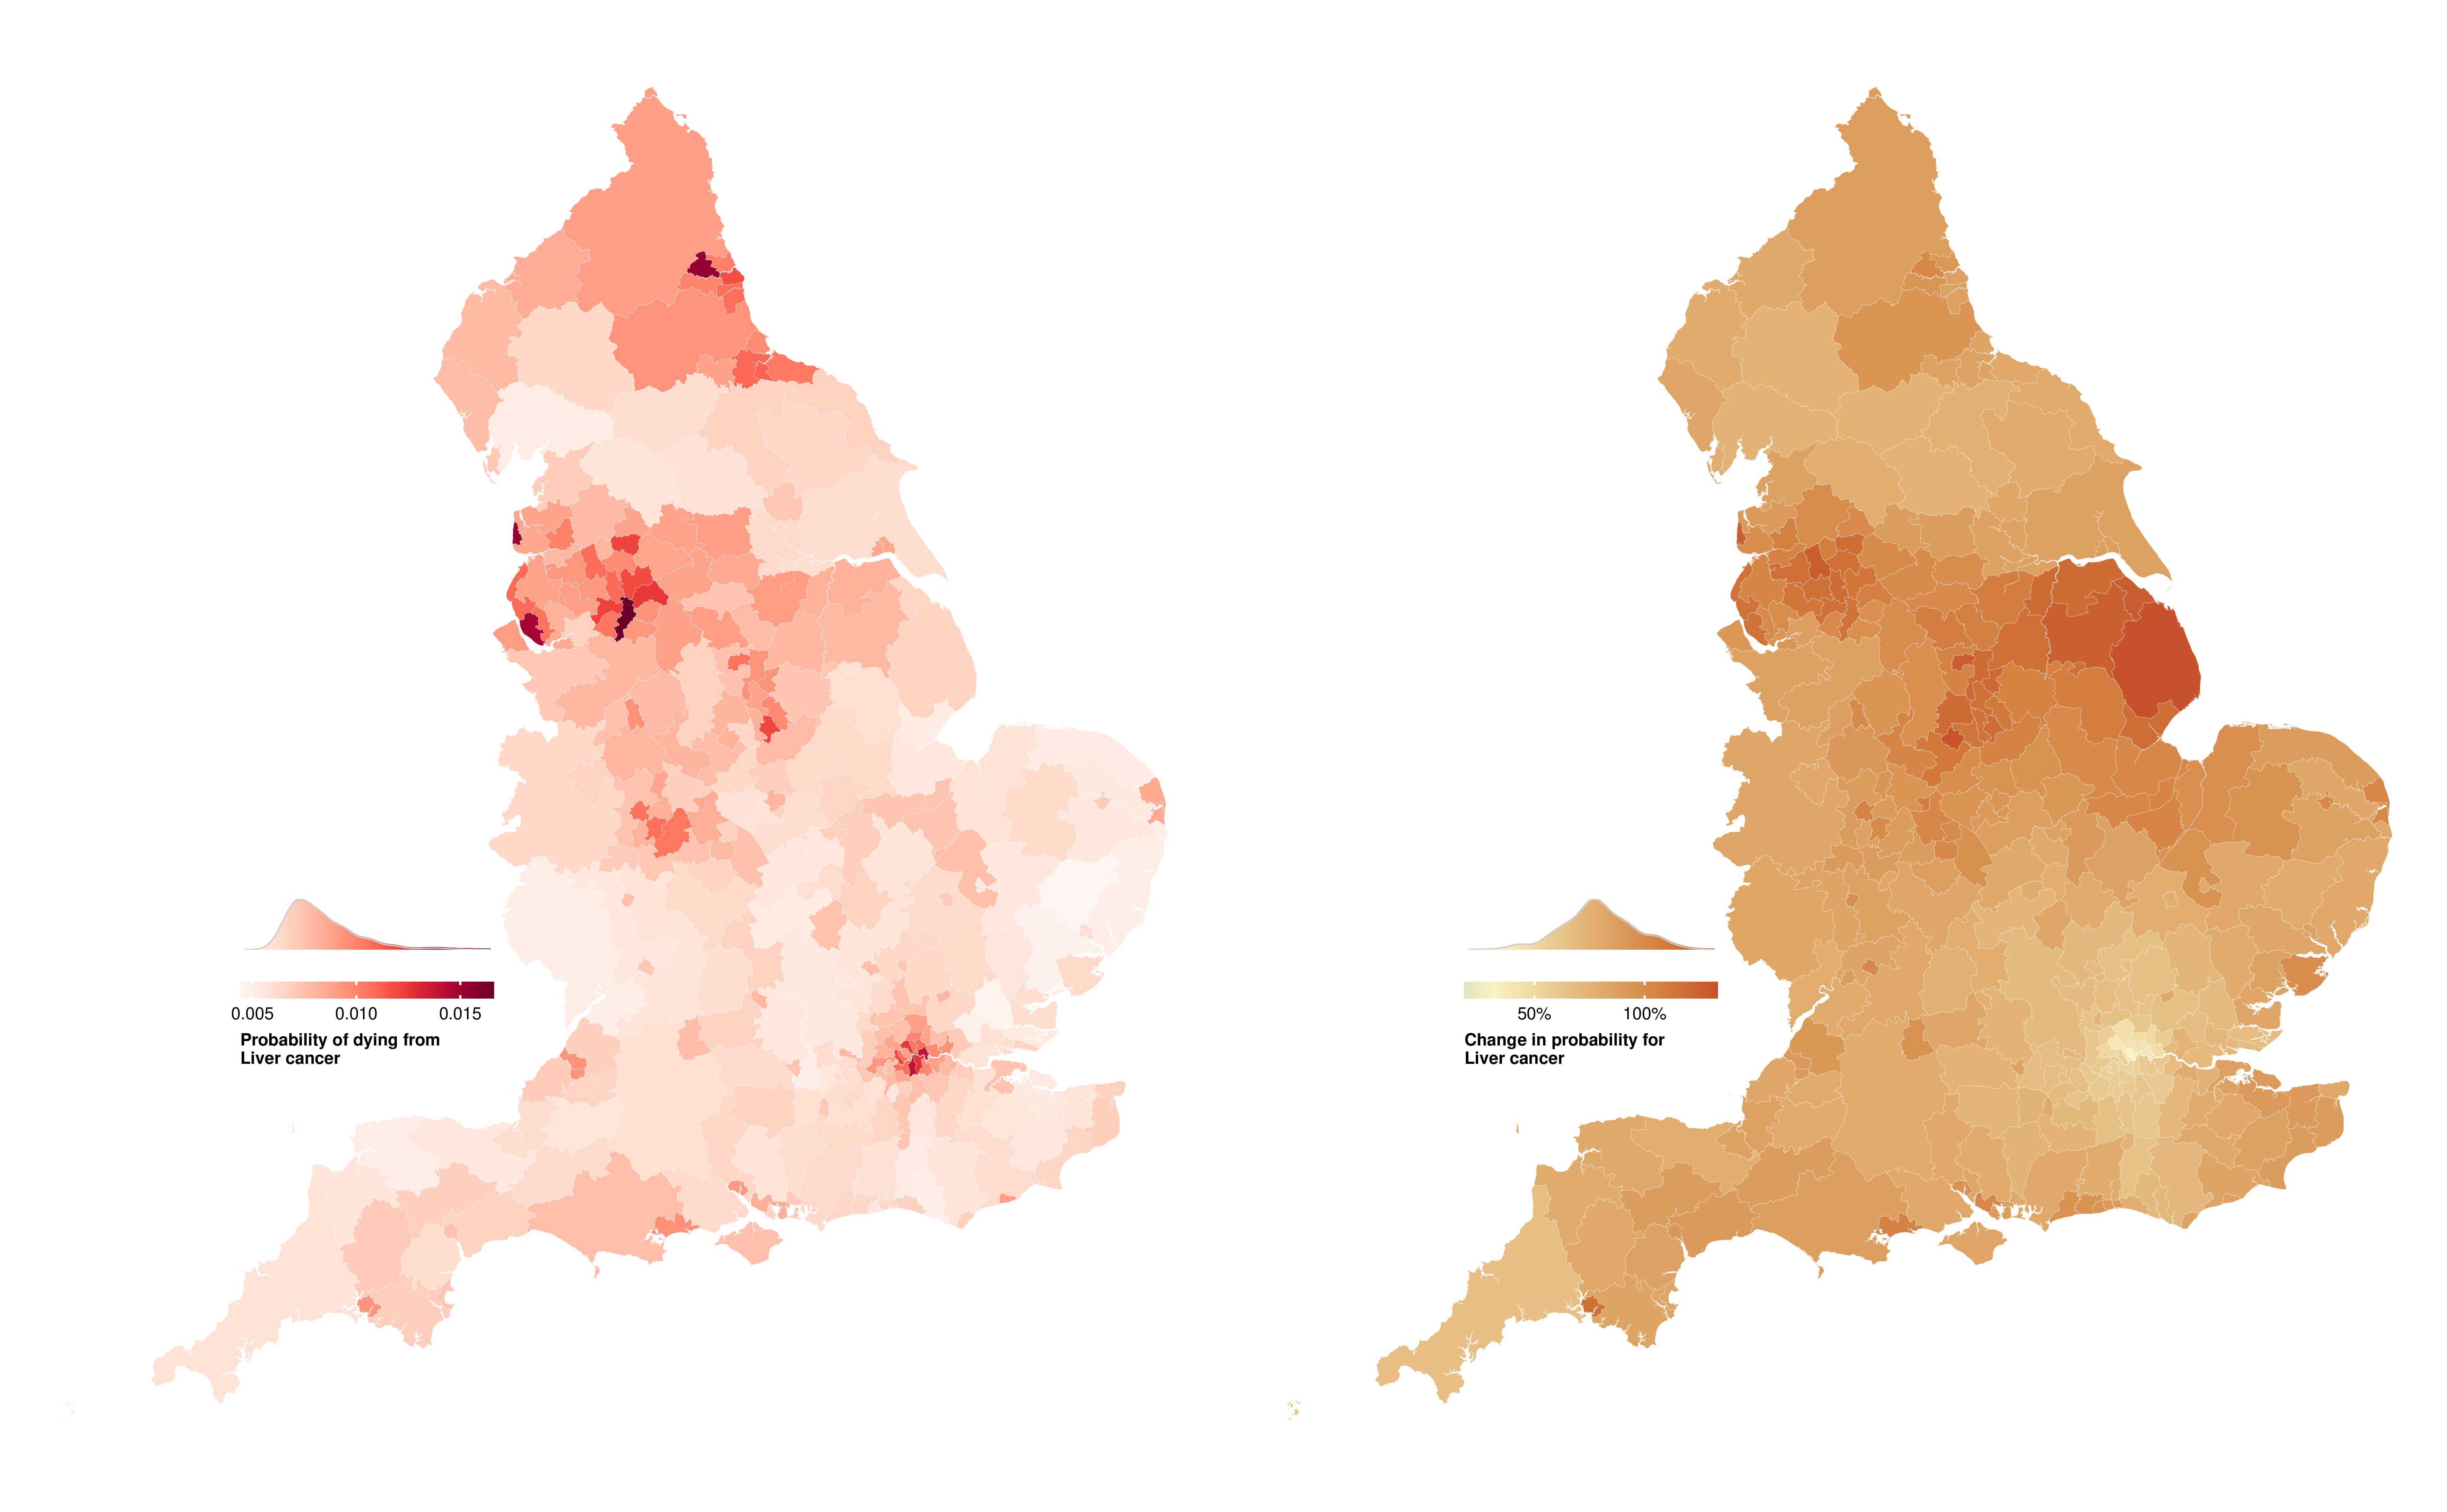
Figure E.20: Probability of dying for men from liver cancer between birth and 80 years of age in 314 local authority districts in England in 2019 and change from 2002 to 2019.
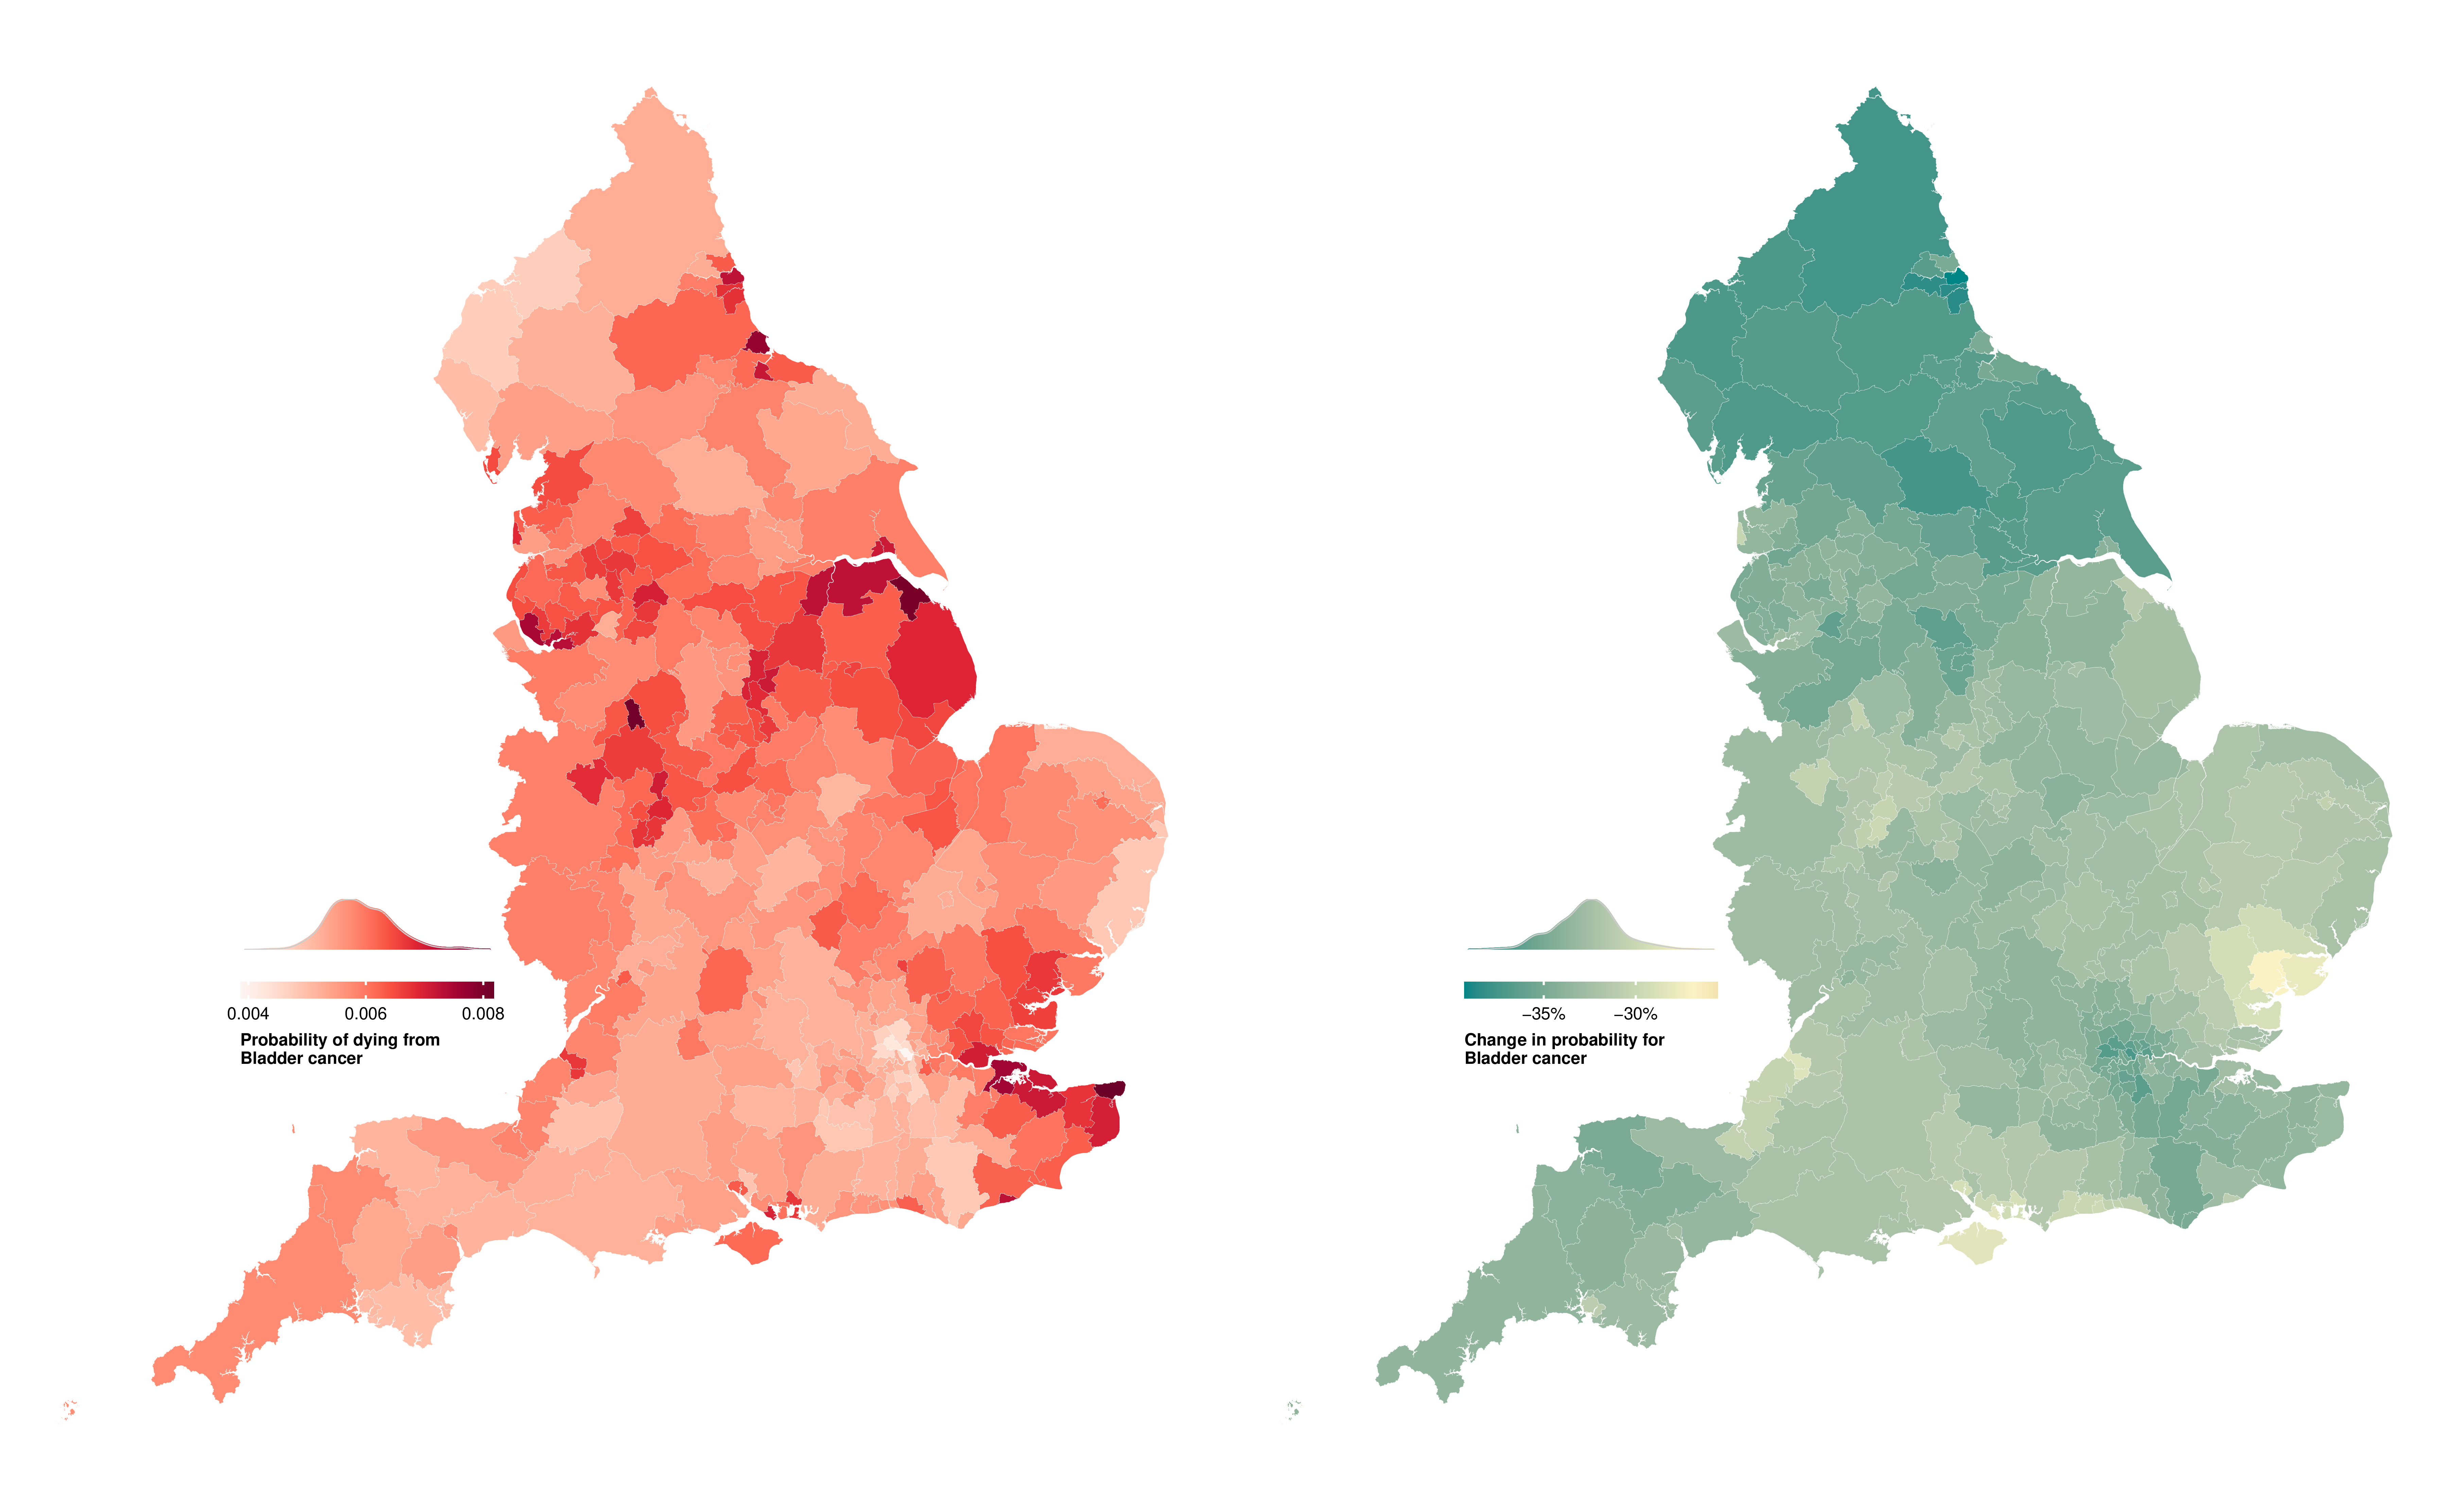
Figure E.21: Probability of dying for men from bladder cancer between birth and 80 years of age in 314 local authority districts in England in 2019 and change from 2002 to 2019.
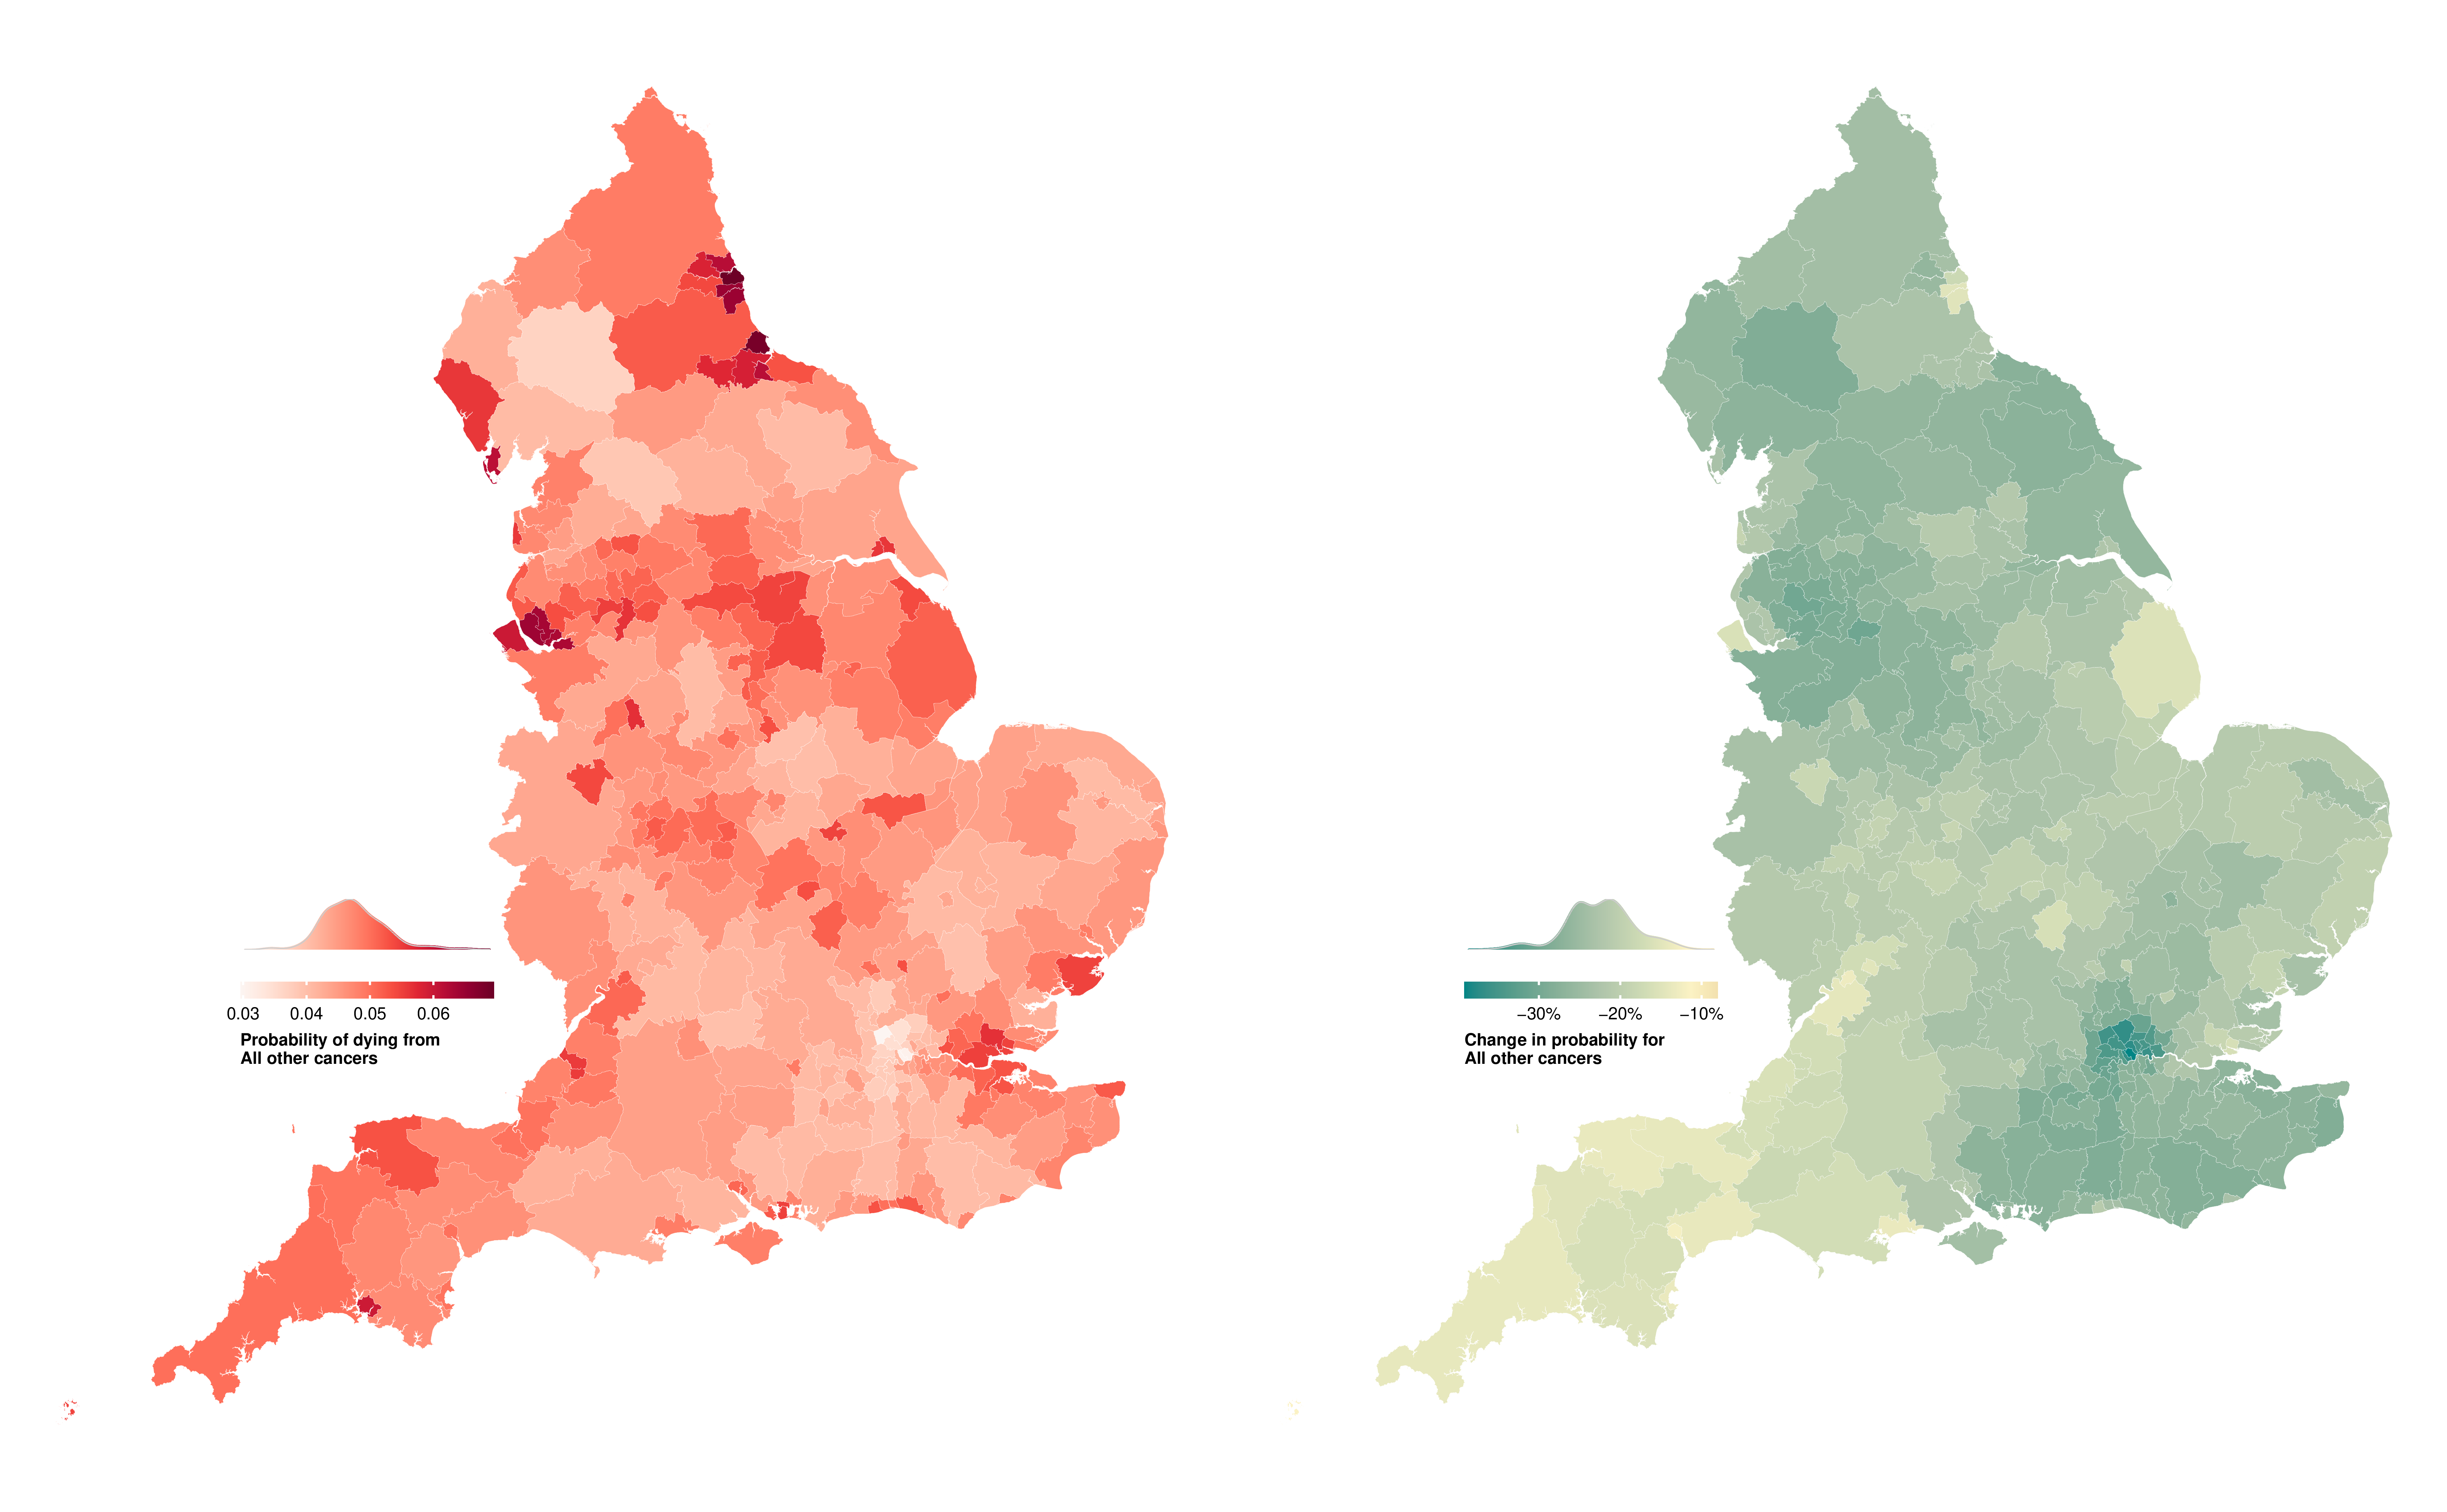
(a) Women
(b) Men
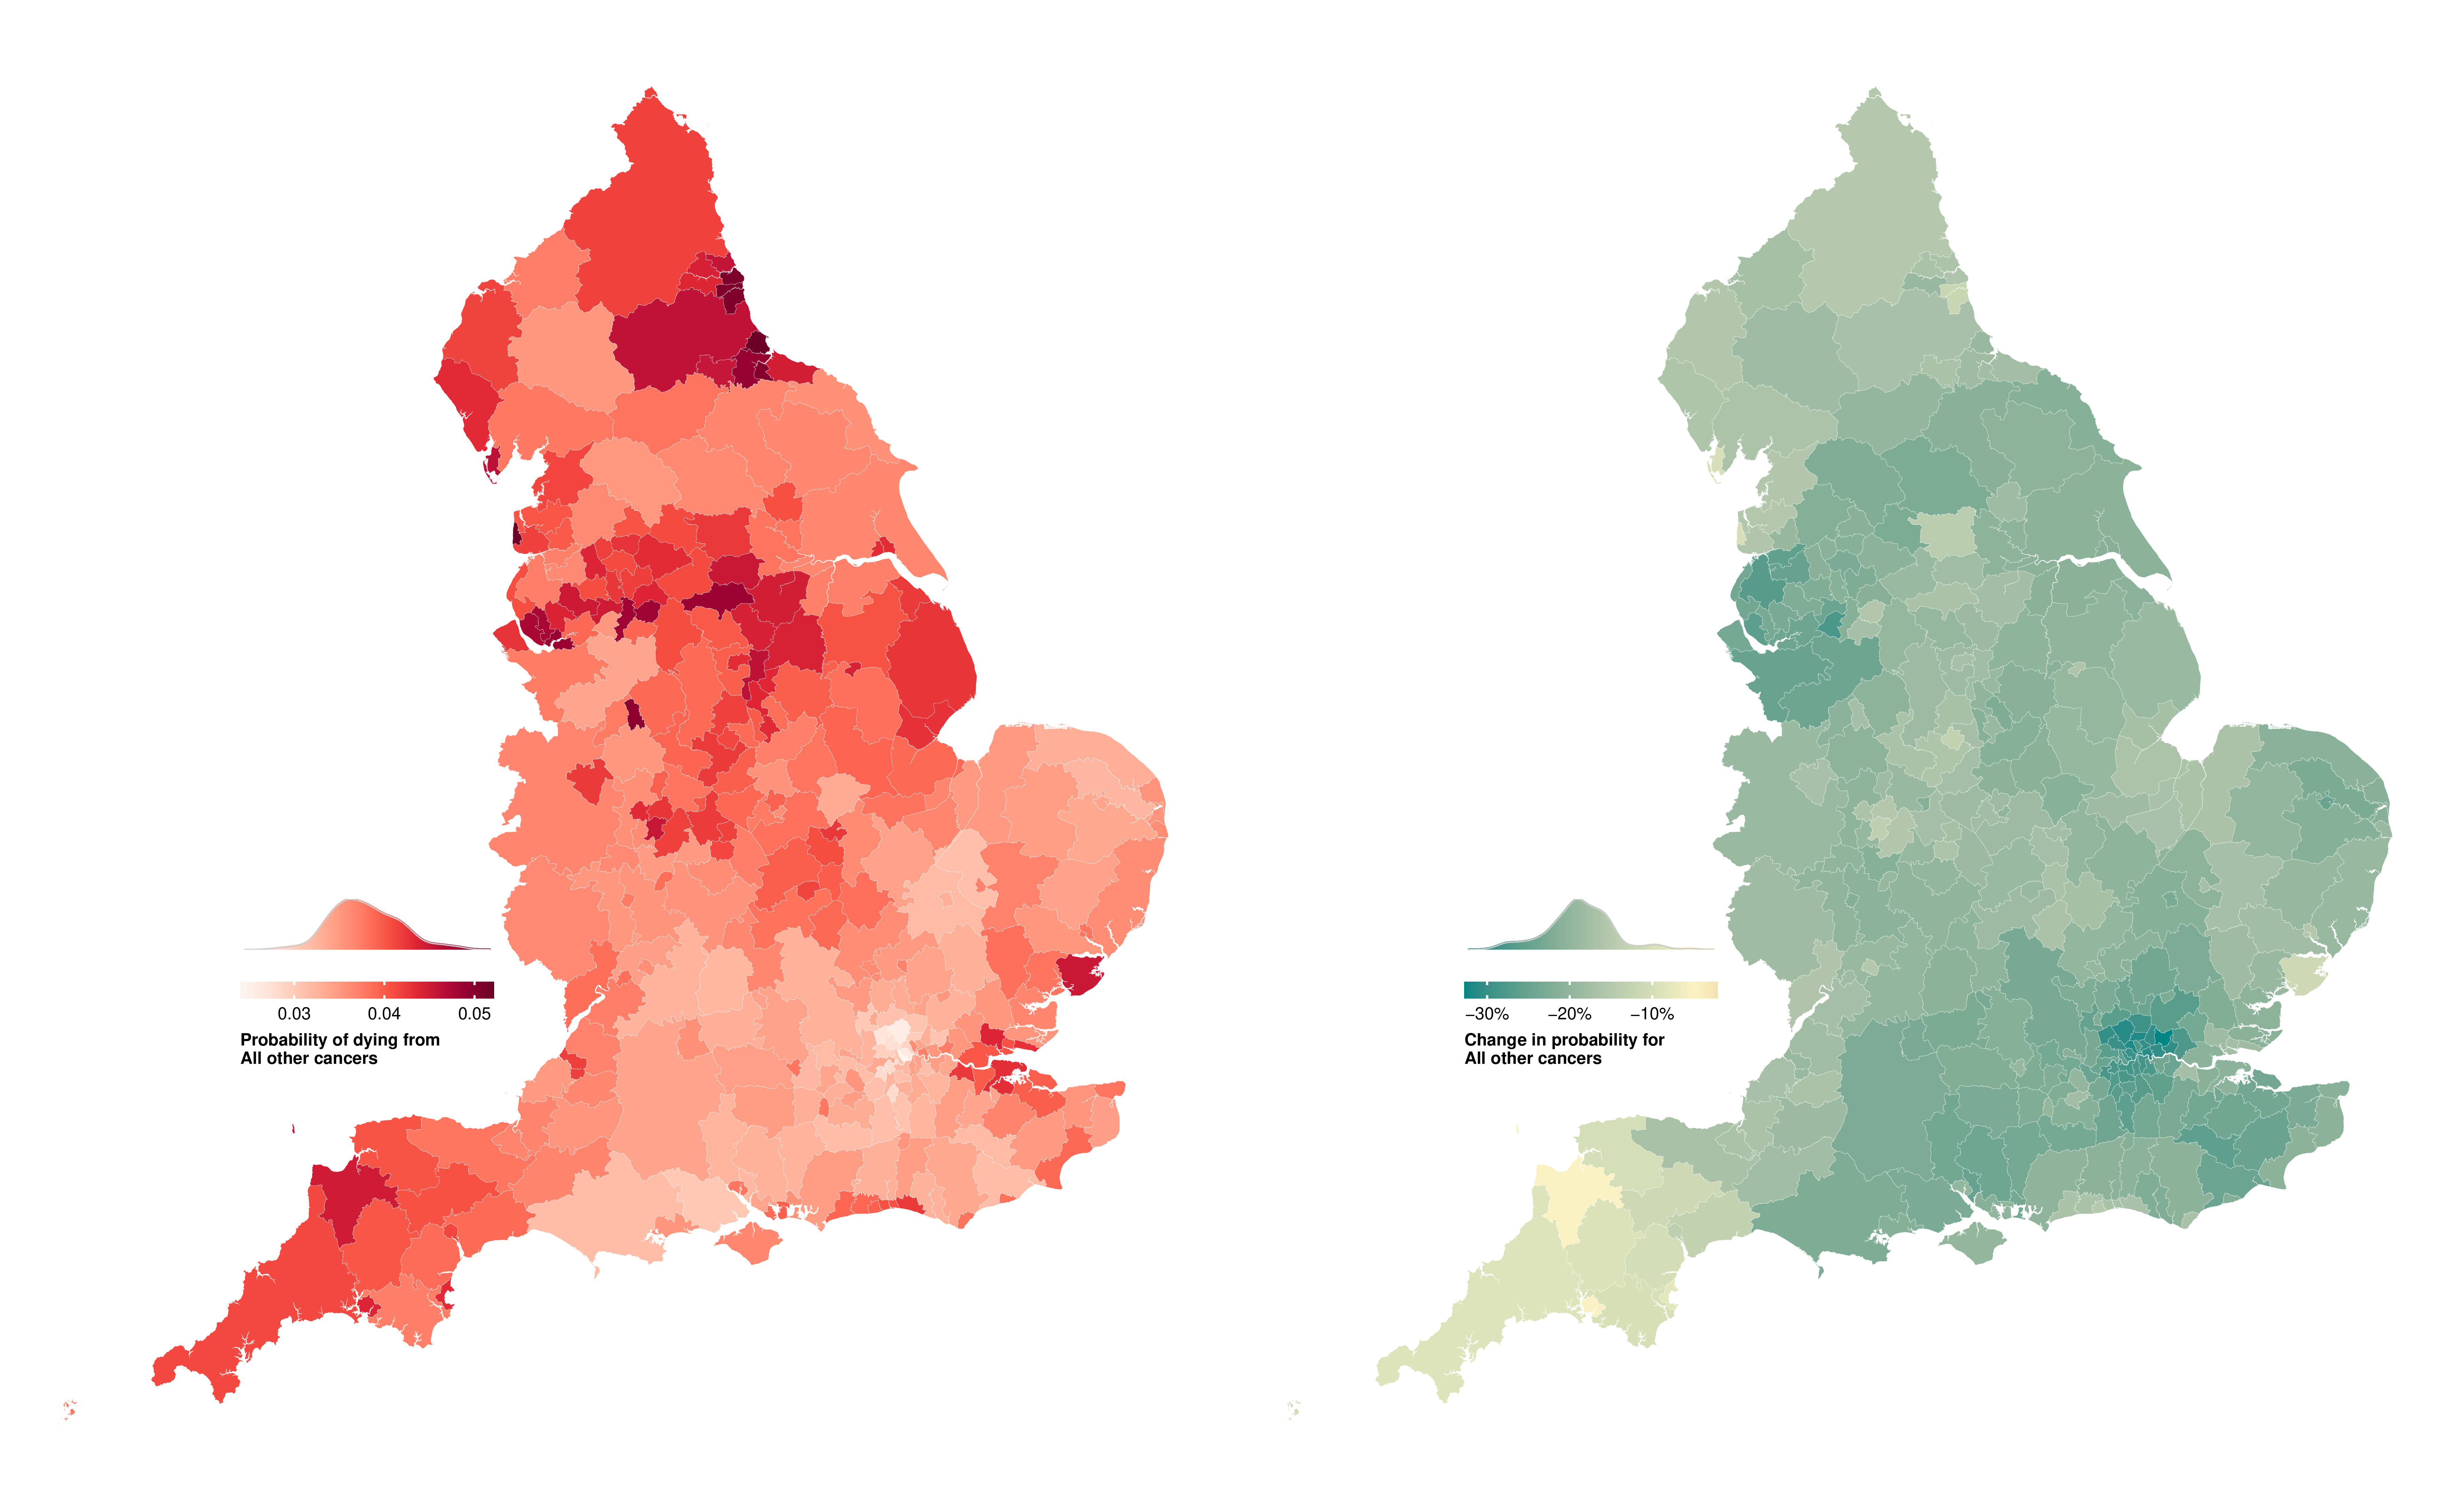
Figure E.22: Probability of dying from all other cancers (cancers only study) between birth and 80 years of age in 314 local authority districts in England in 2019 and change from 2002 to 2019.
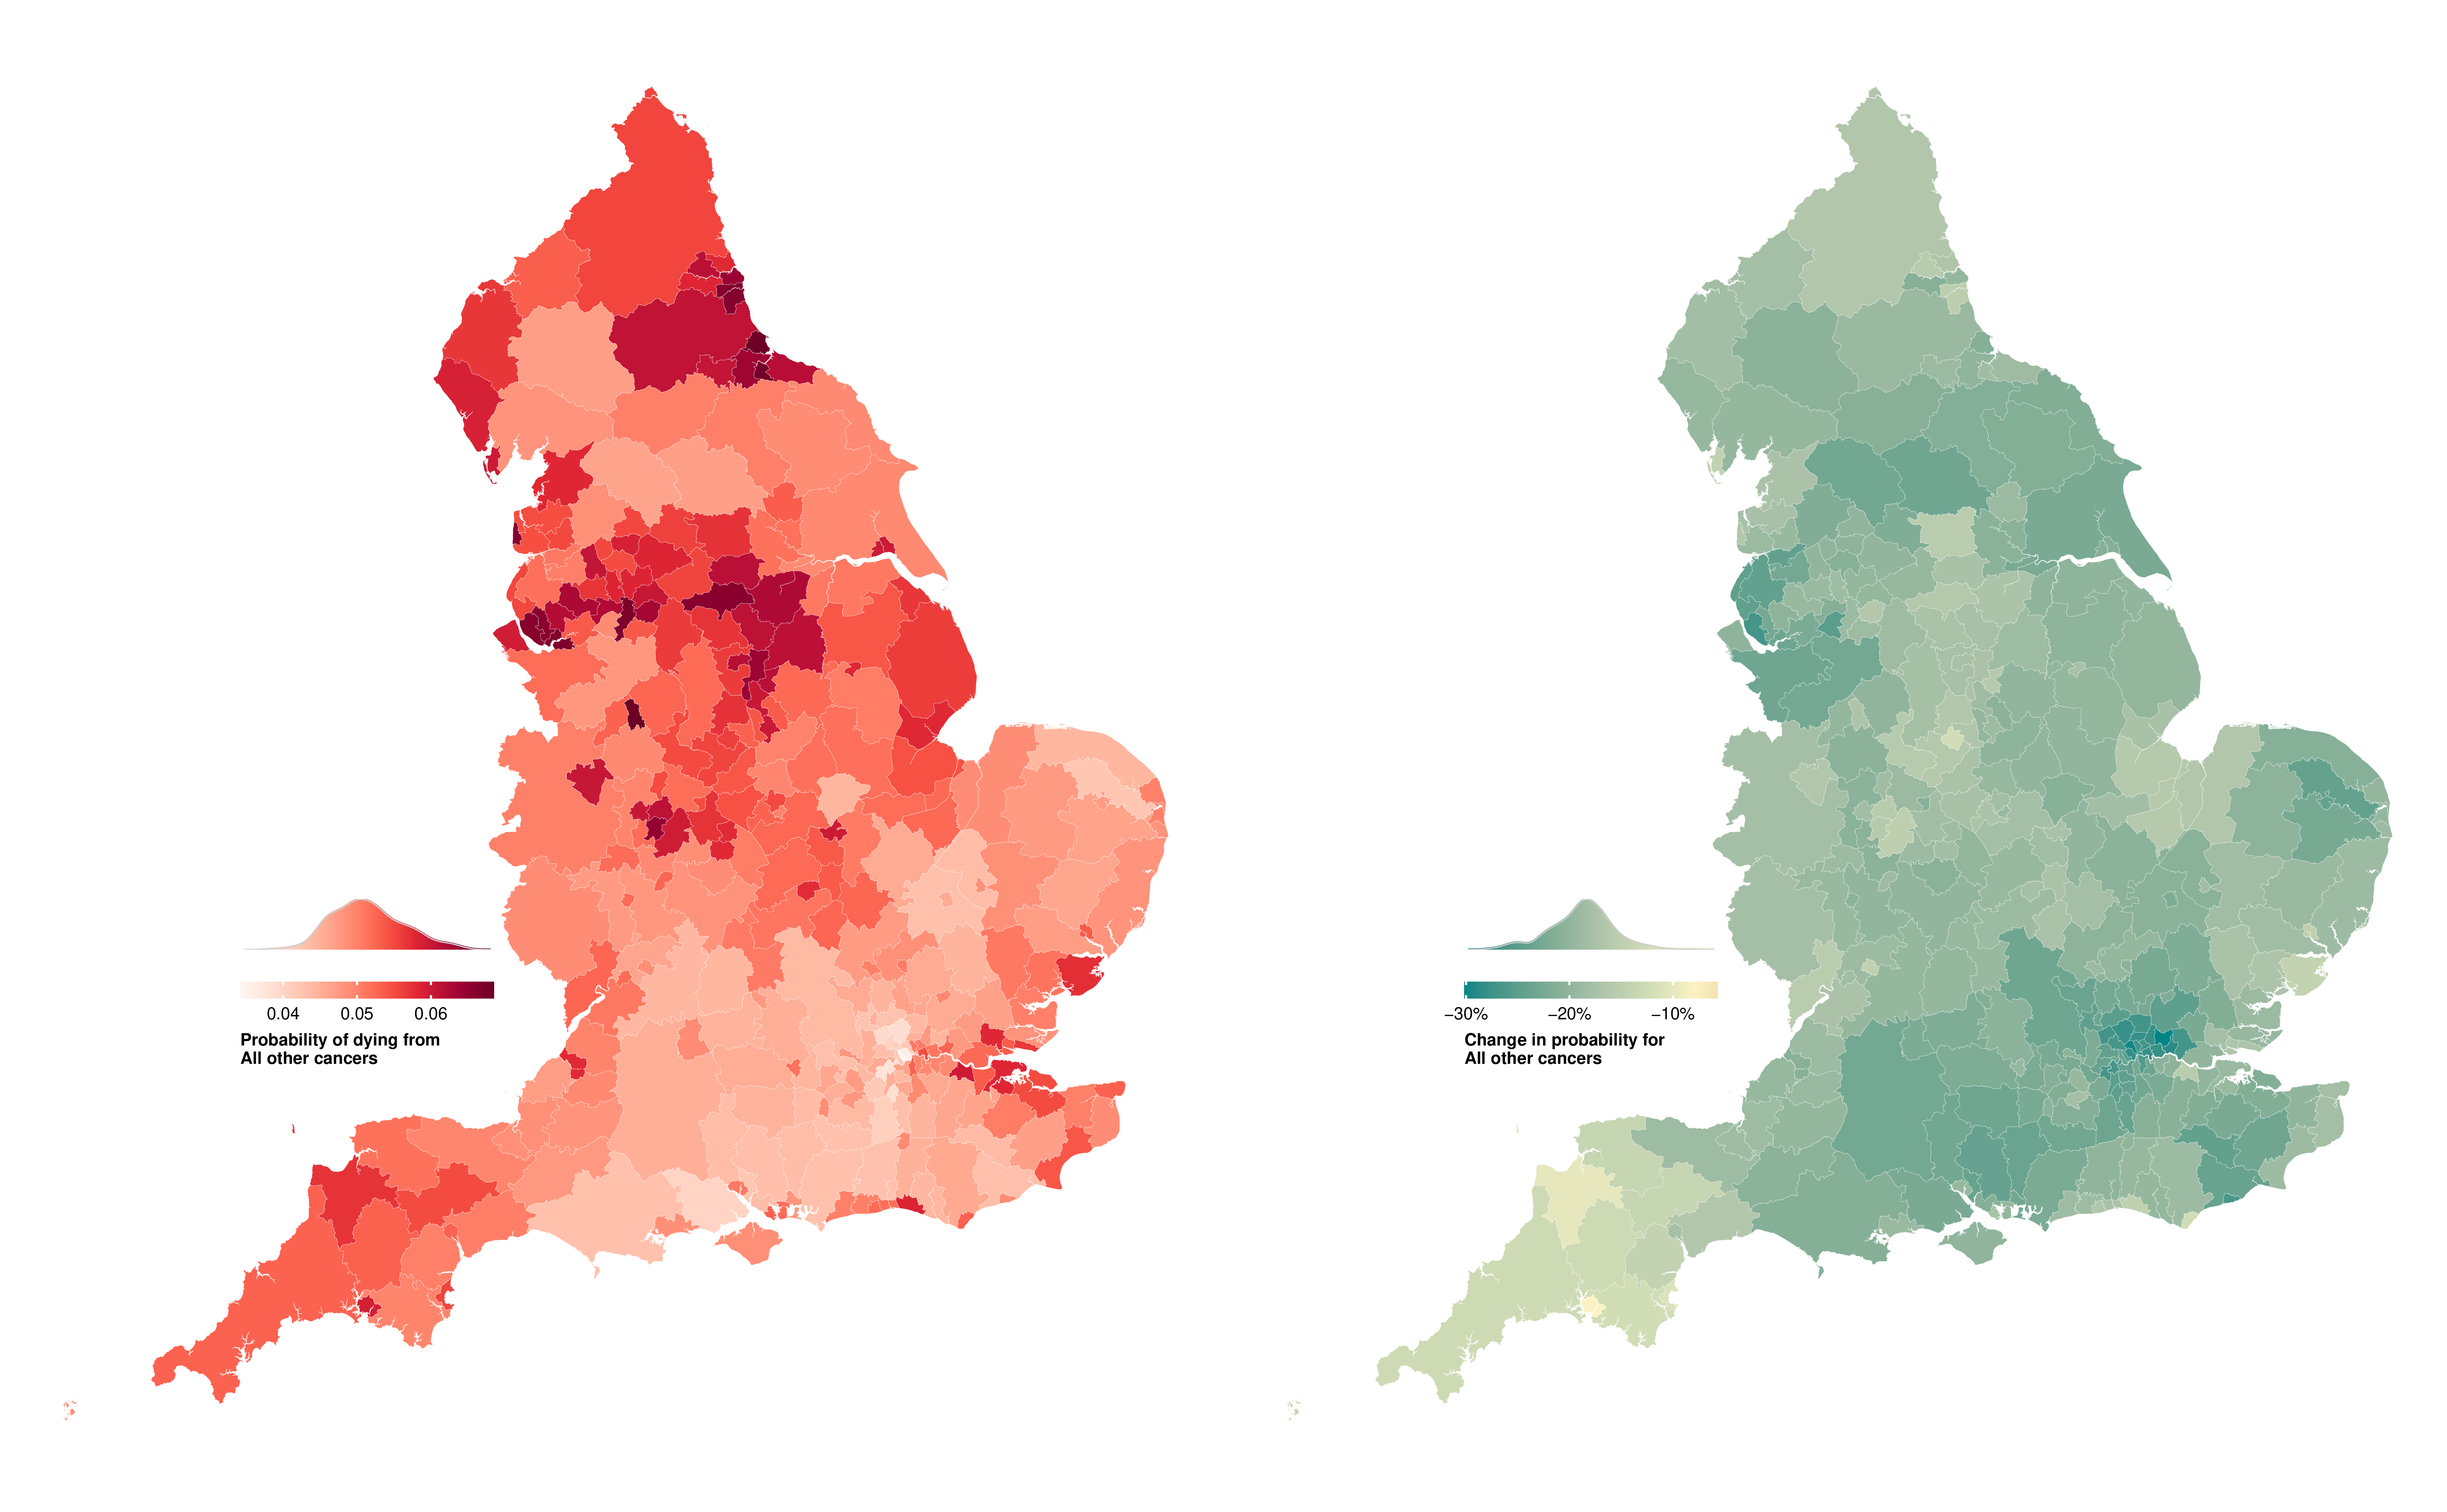
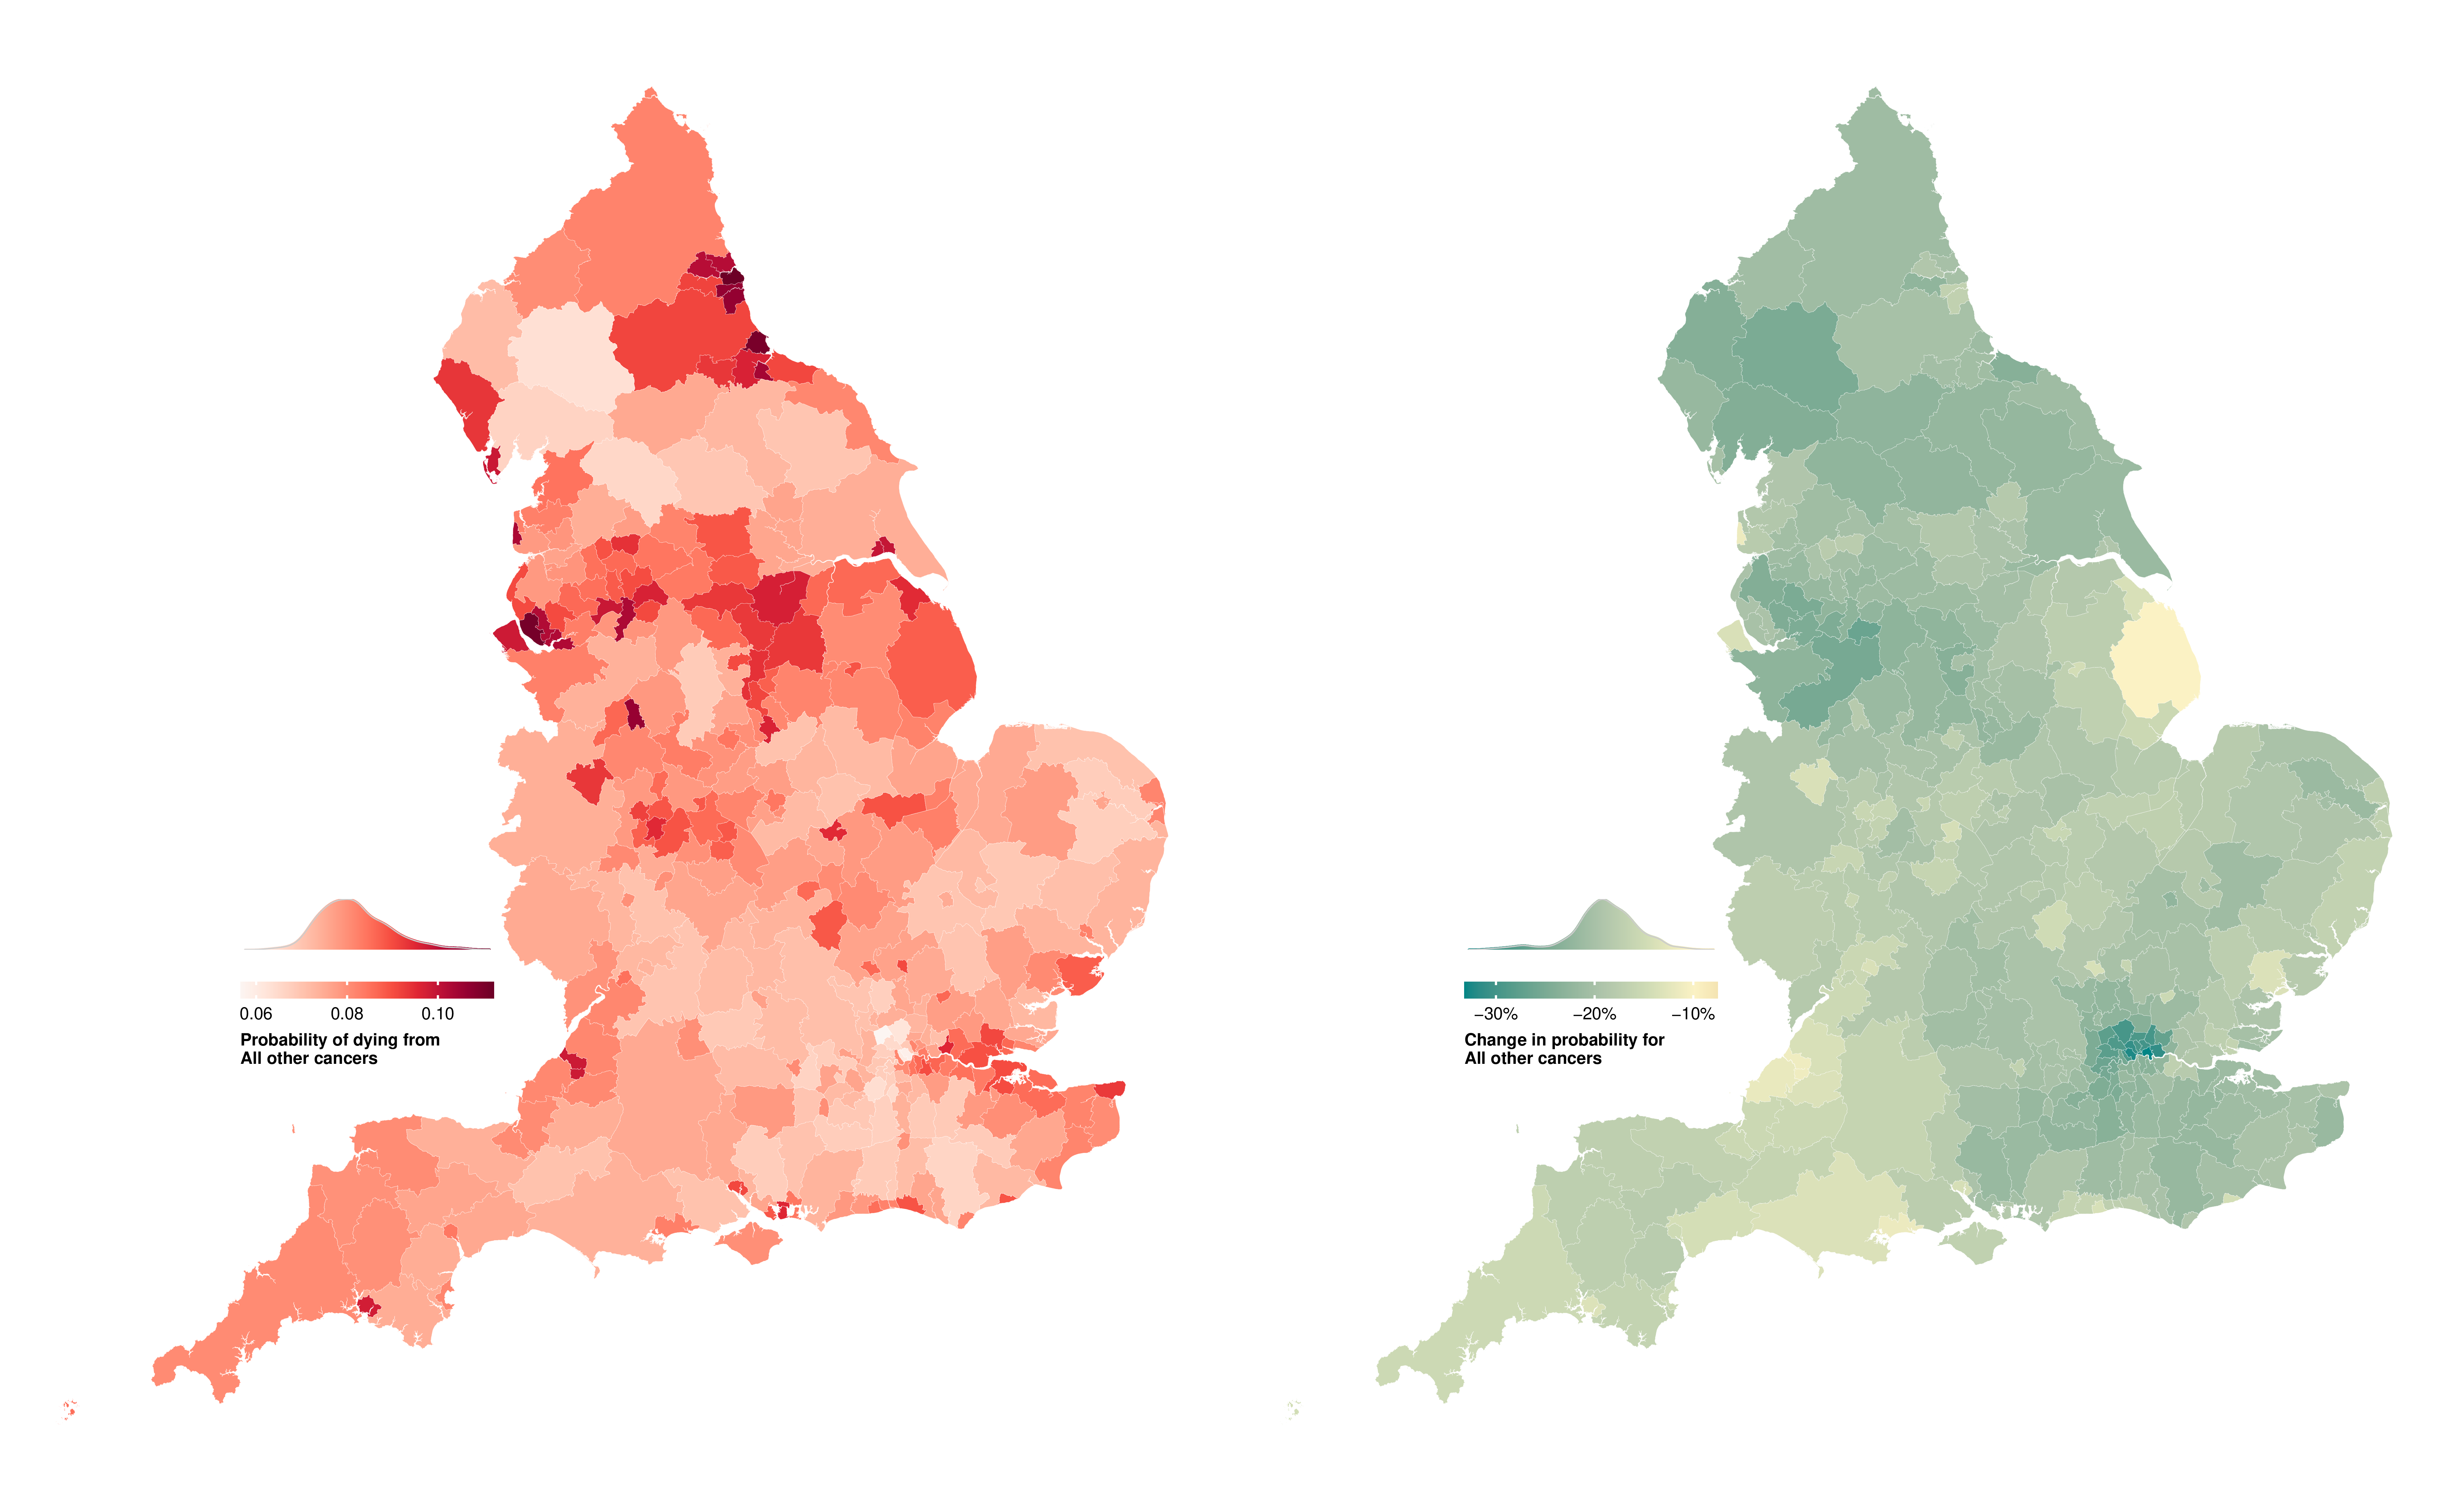
(a) Women
(b) Men
Figure E.23: Probability of dying from all other cancers (cause-specific mortality study) between birth and 80 years of age in 314 local authority districts in England in 2019 and change from 2002 to 2019.
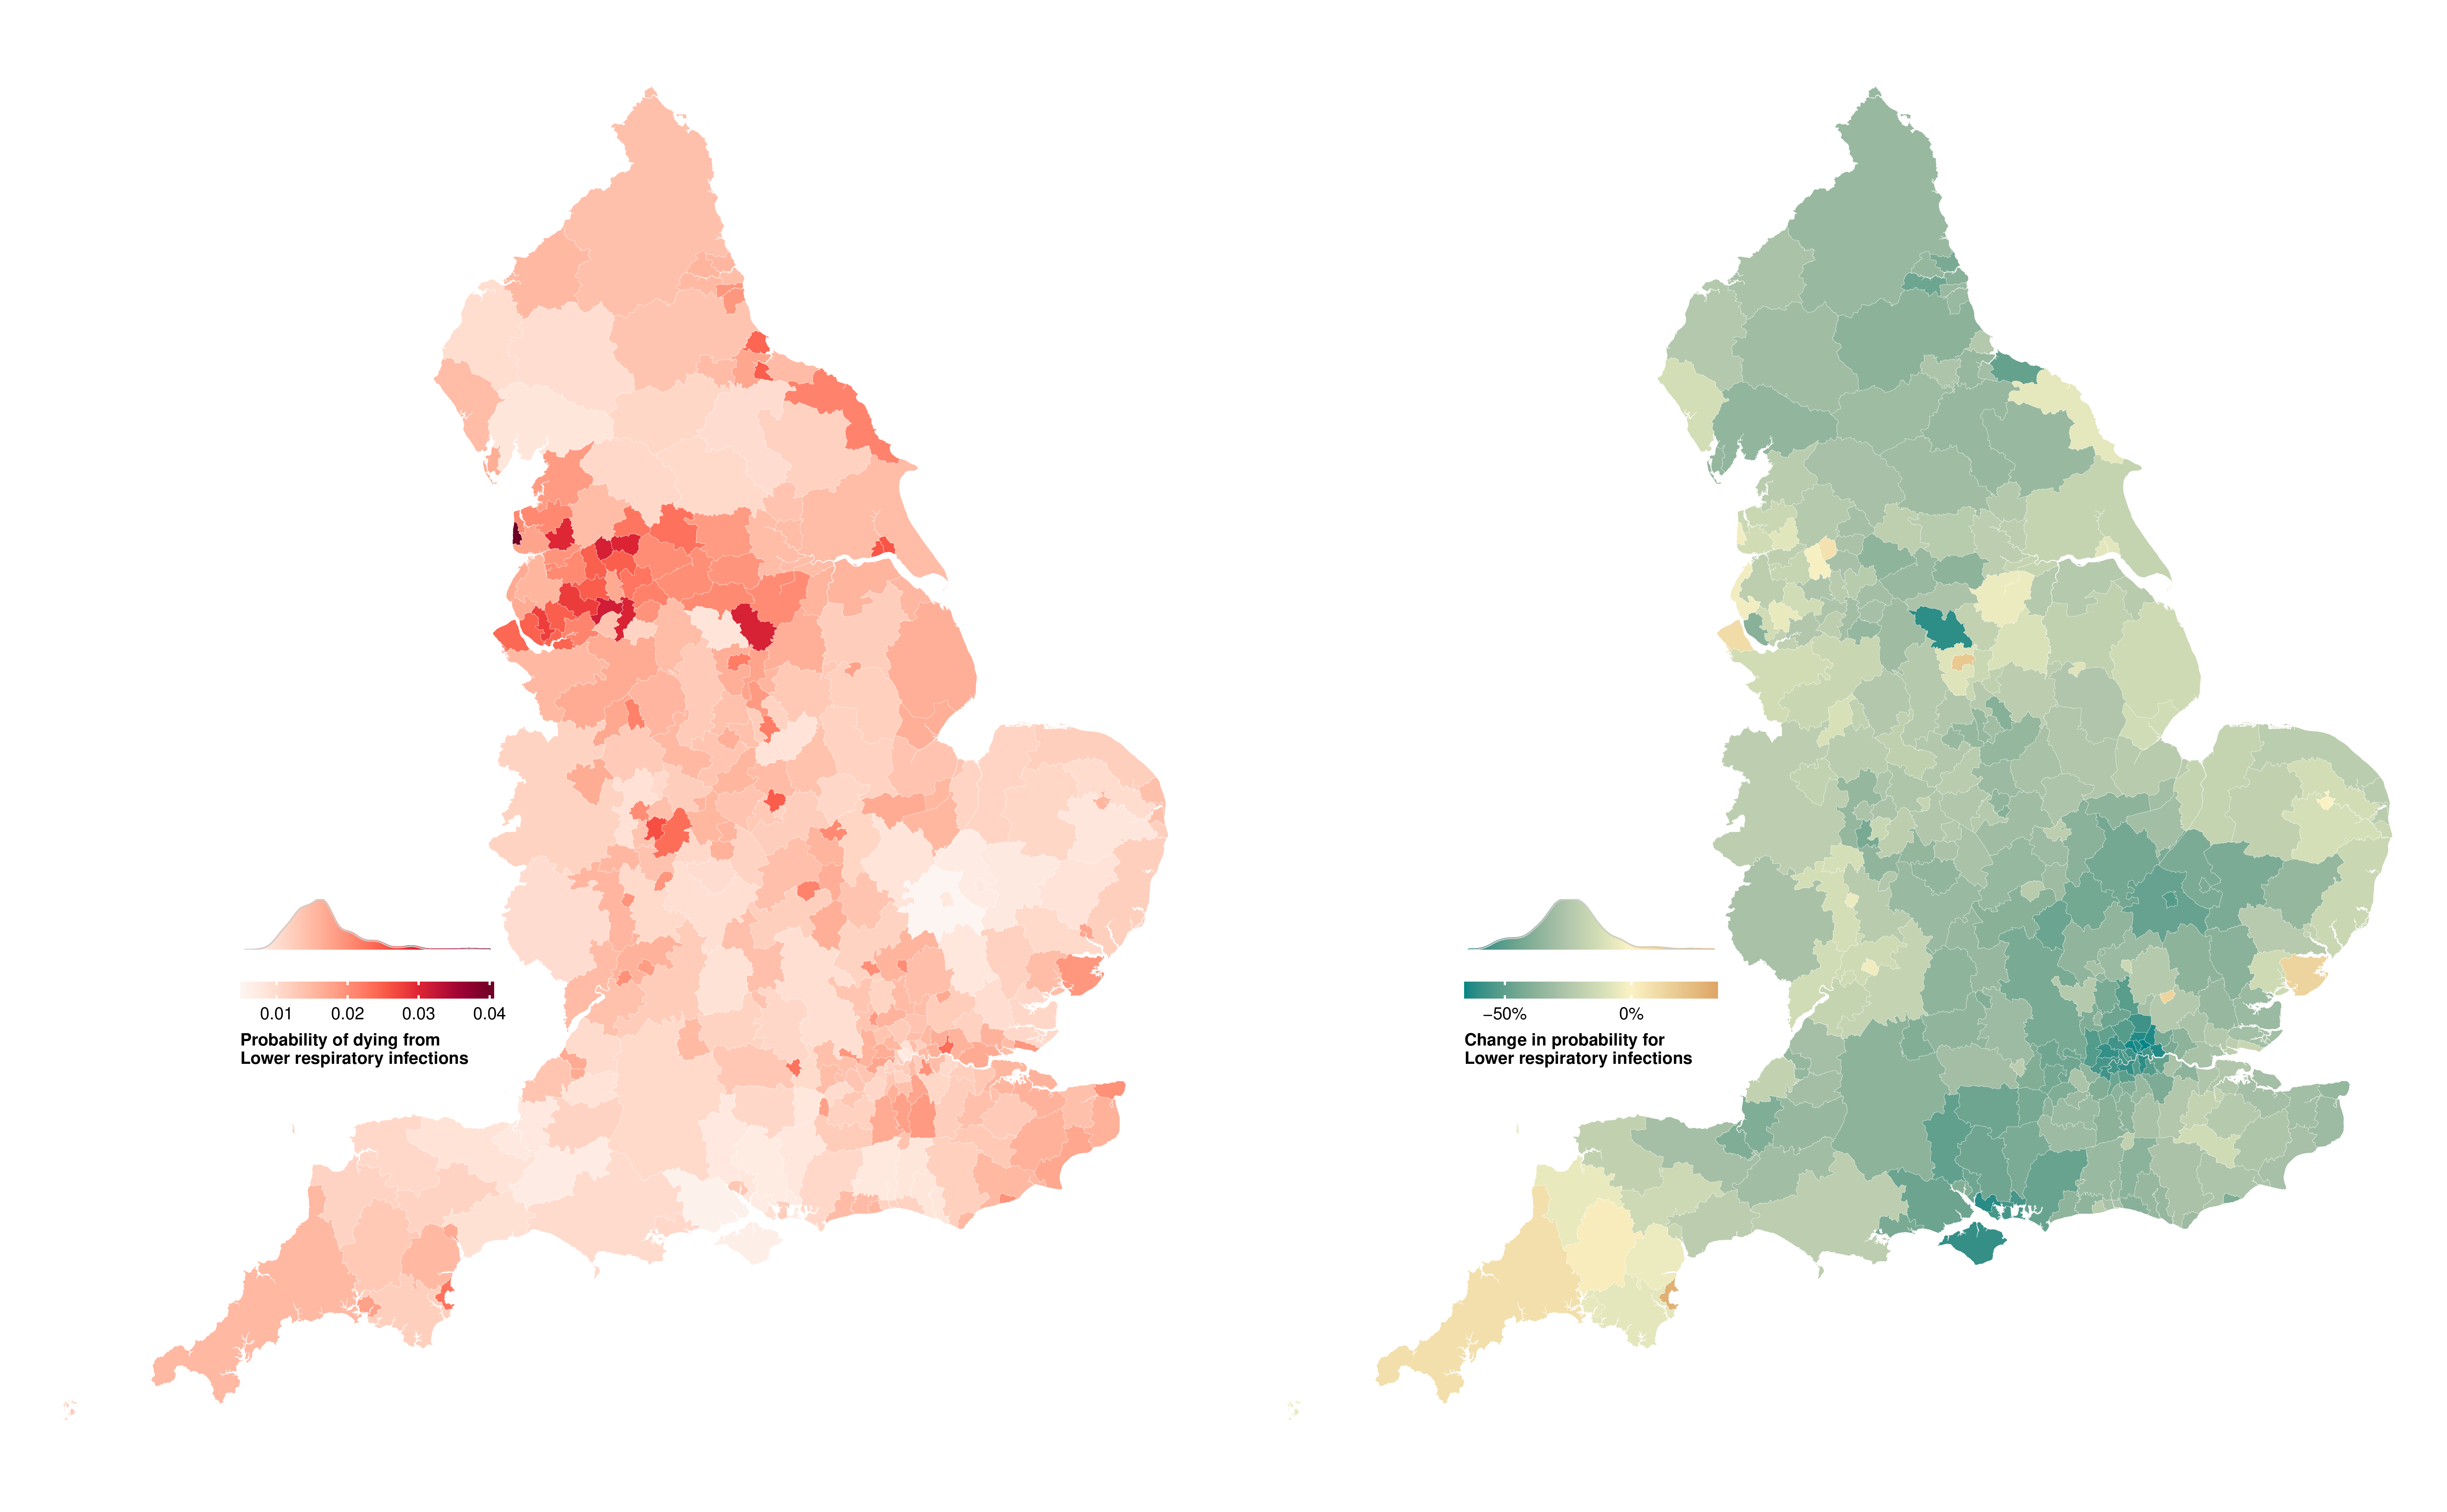
(a) Women
(b) Men
Figure E.24: Probability of dying from lower respiratory infections between birth and 80 years of age in 314 local authority districts in England in 2019 and change from 2002 to 2019.
(a) Women
(b) Men
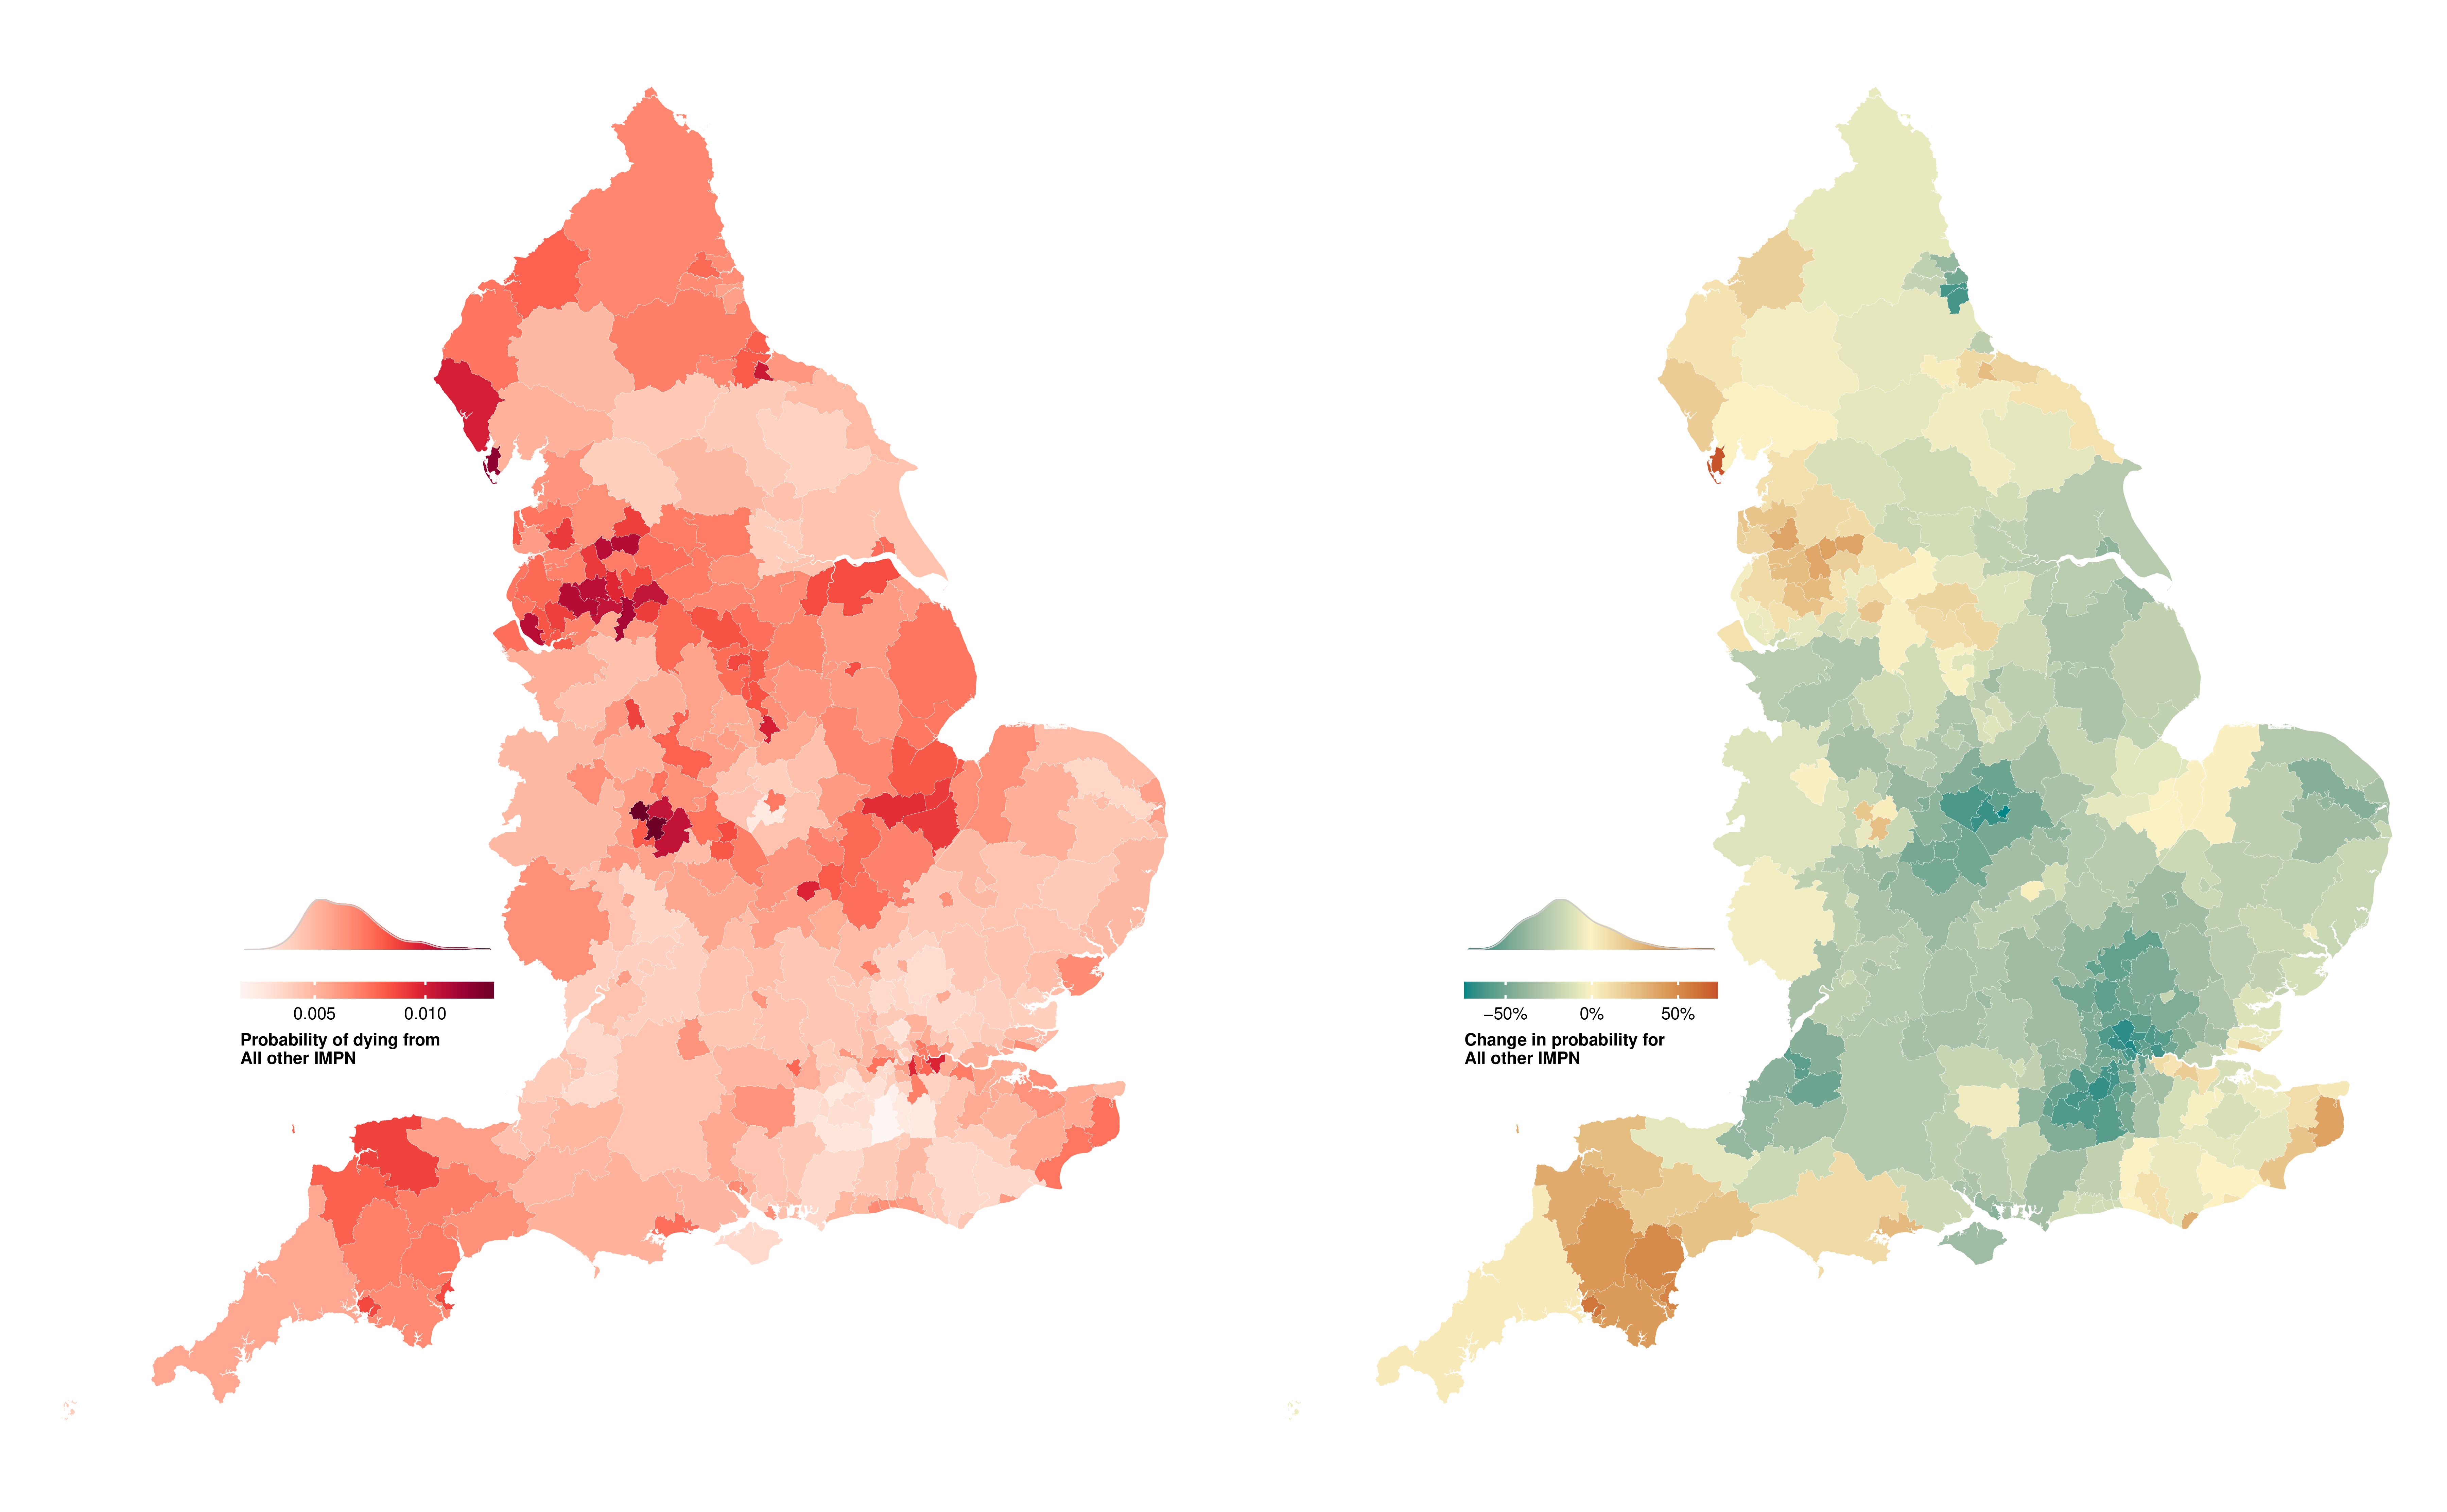
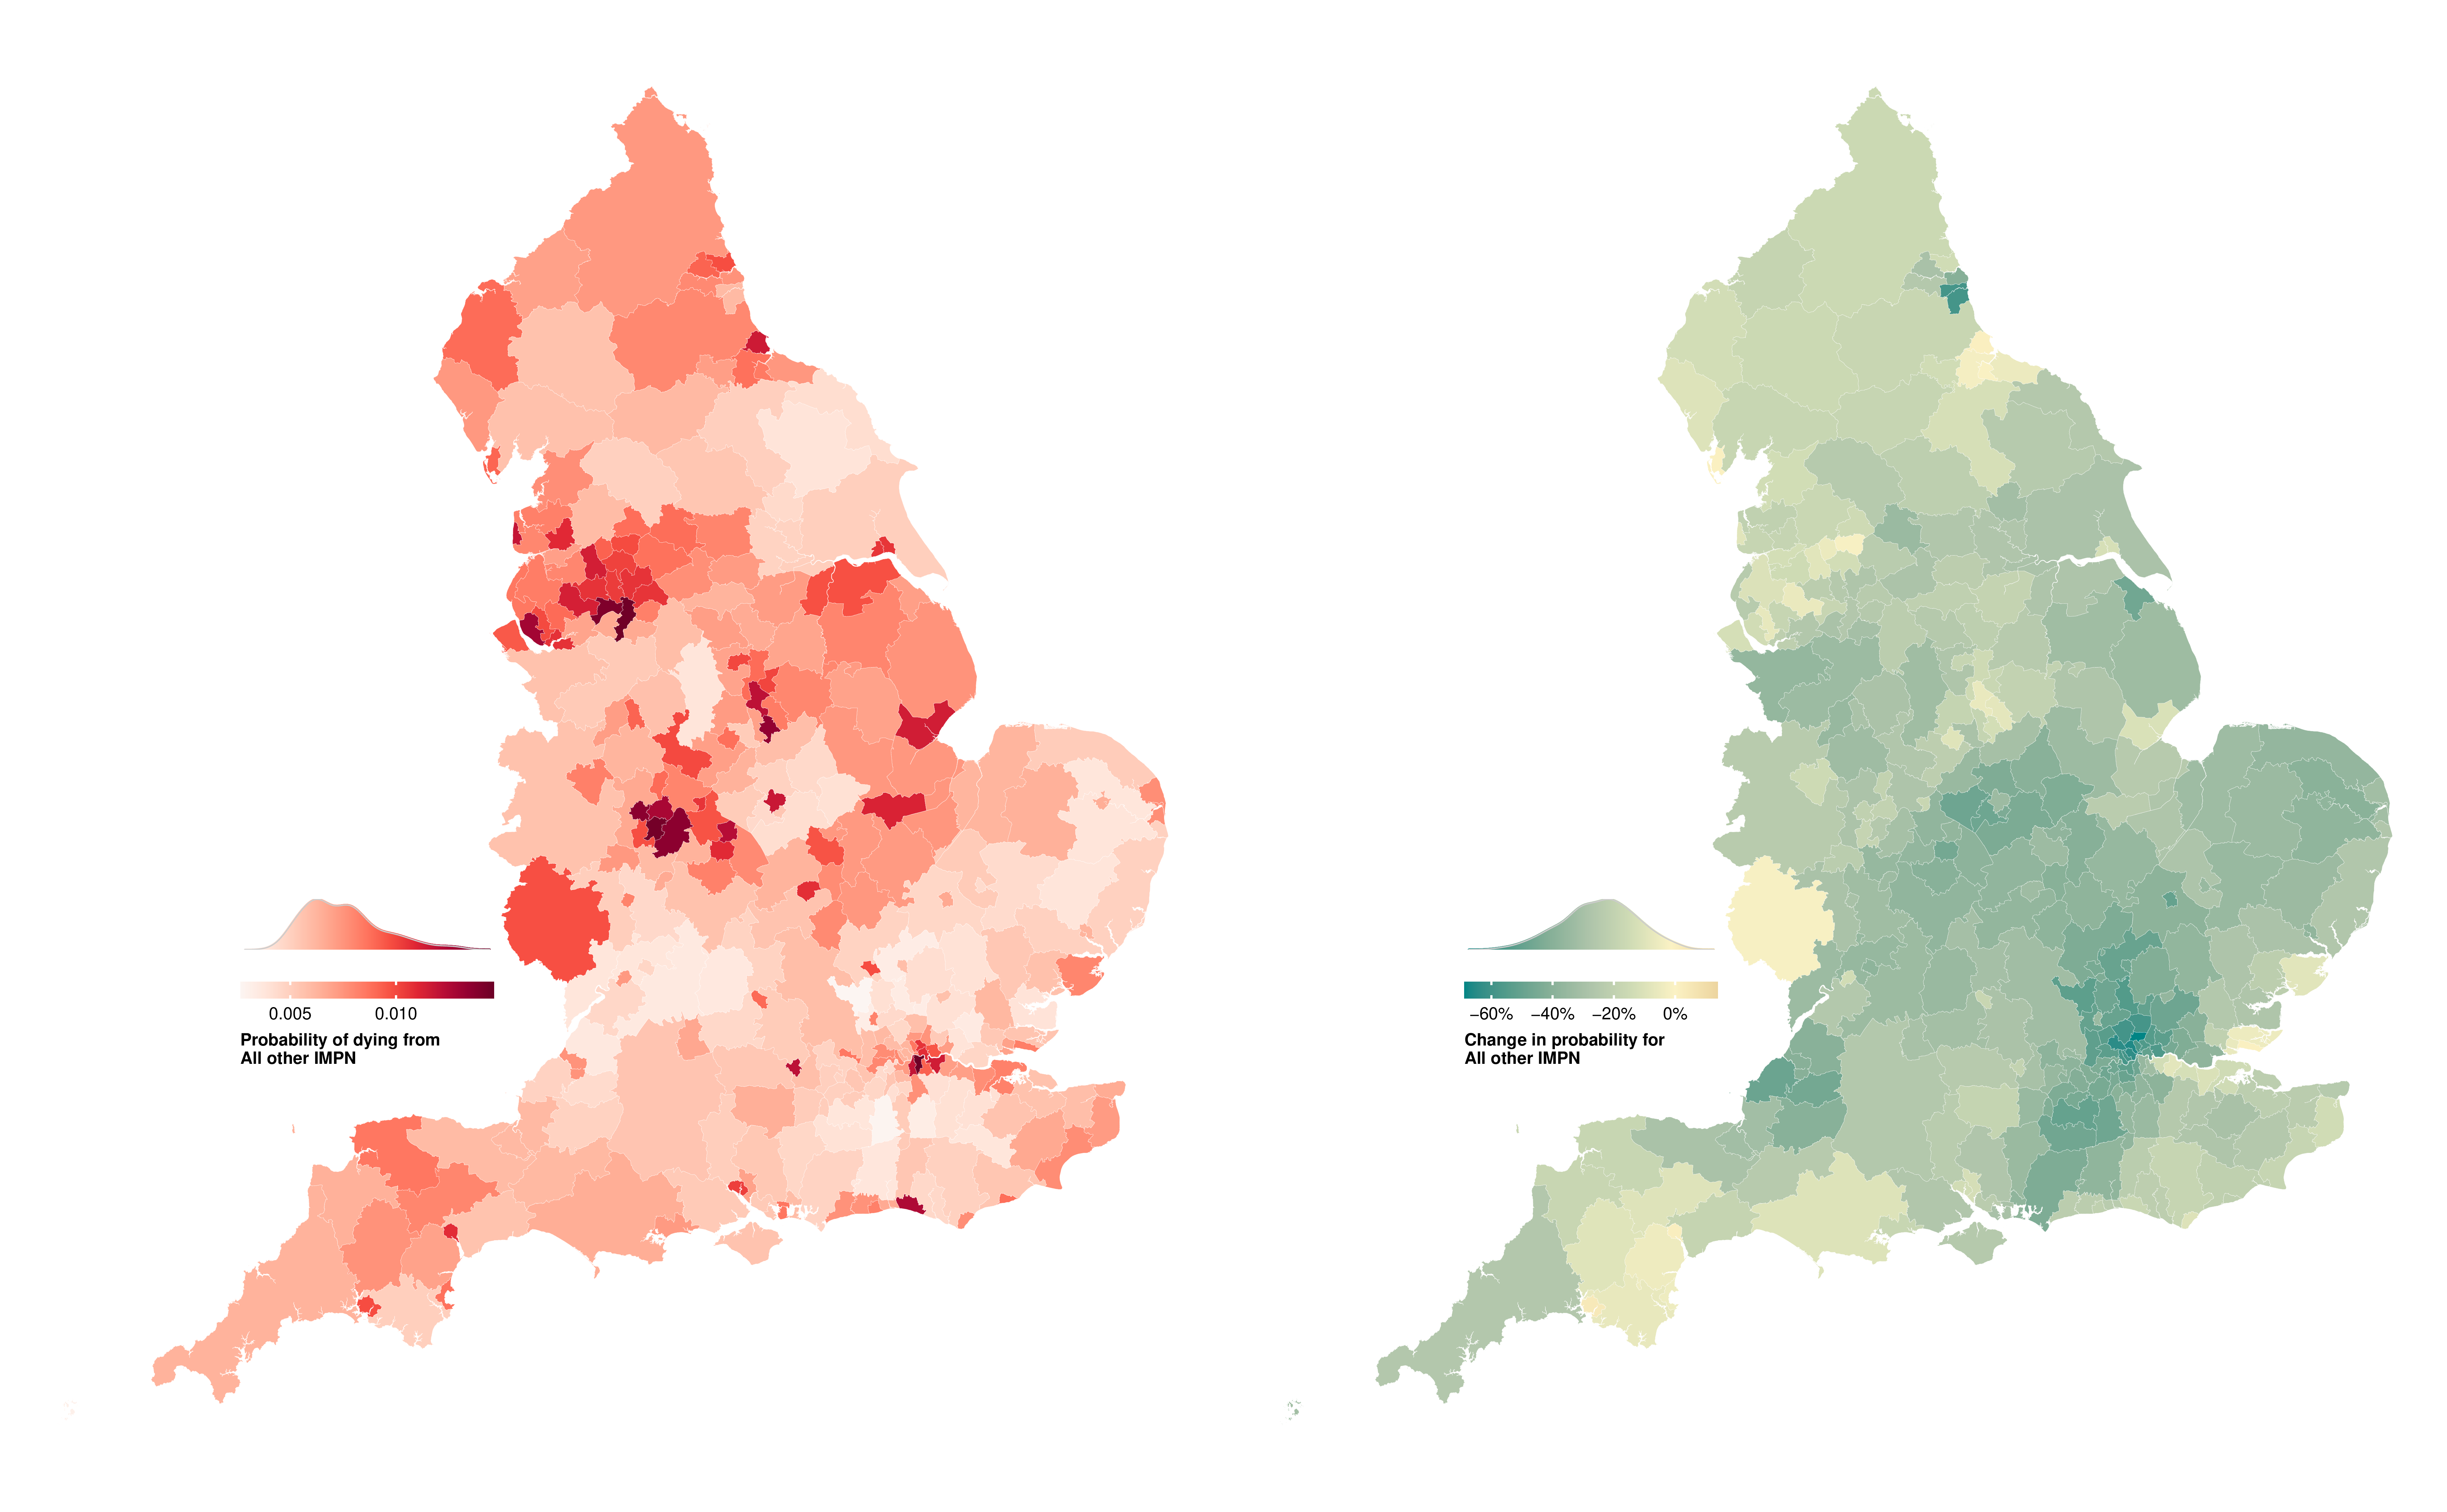
Figure E.25: Probability of dying from all other infections, maternal, perinatal and nutritional conditions between birth and 80 years of age in 314 local authority districts in England in 2019 and change from 2002 to 2019.
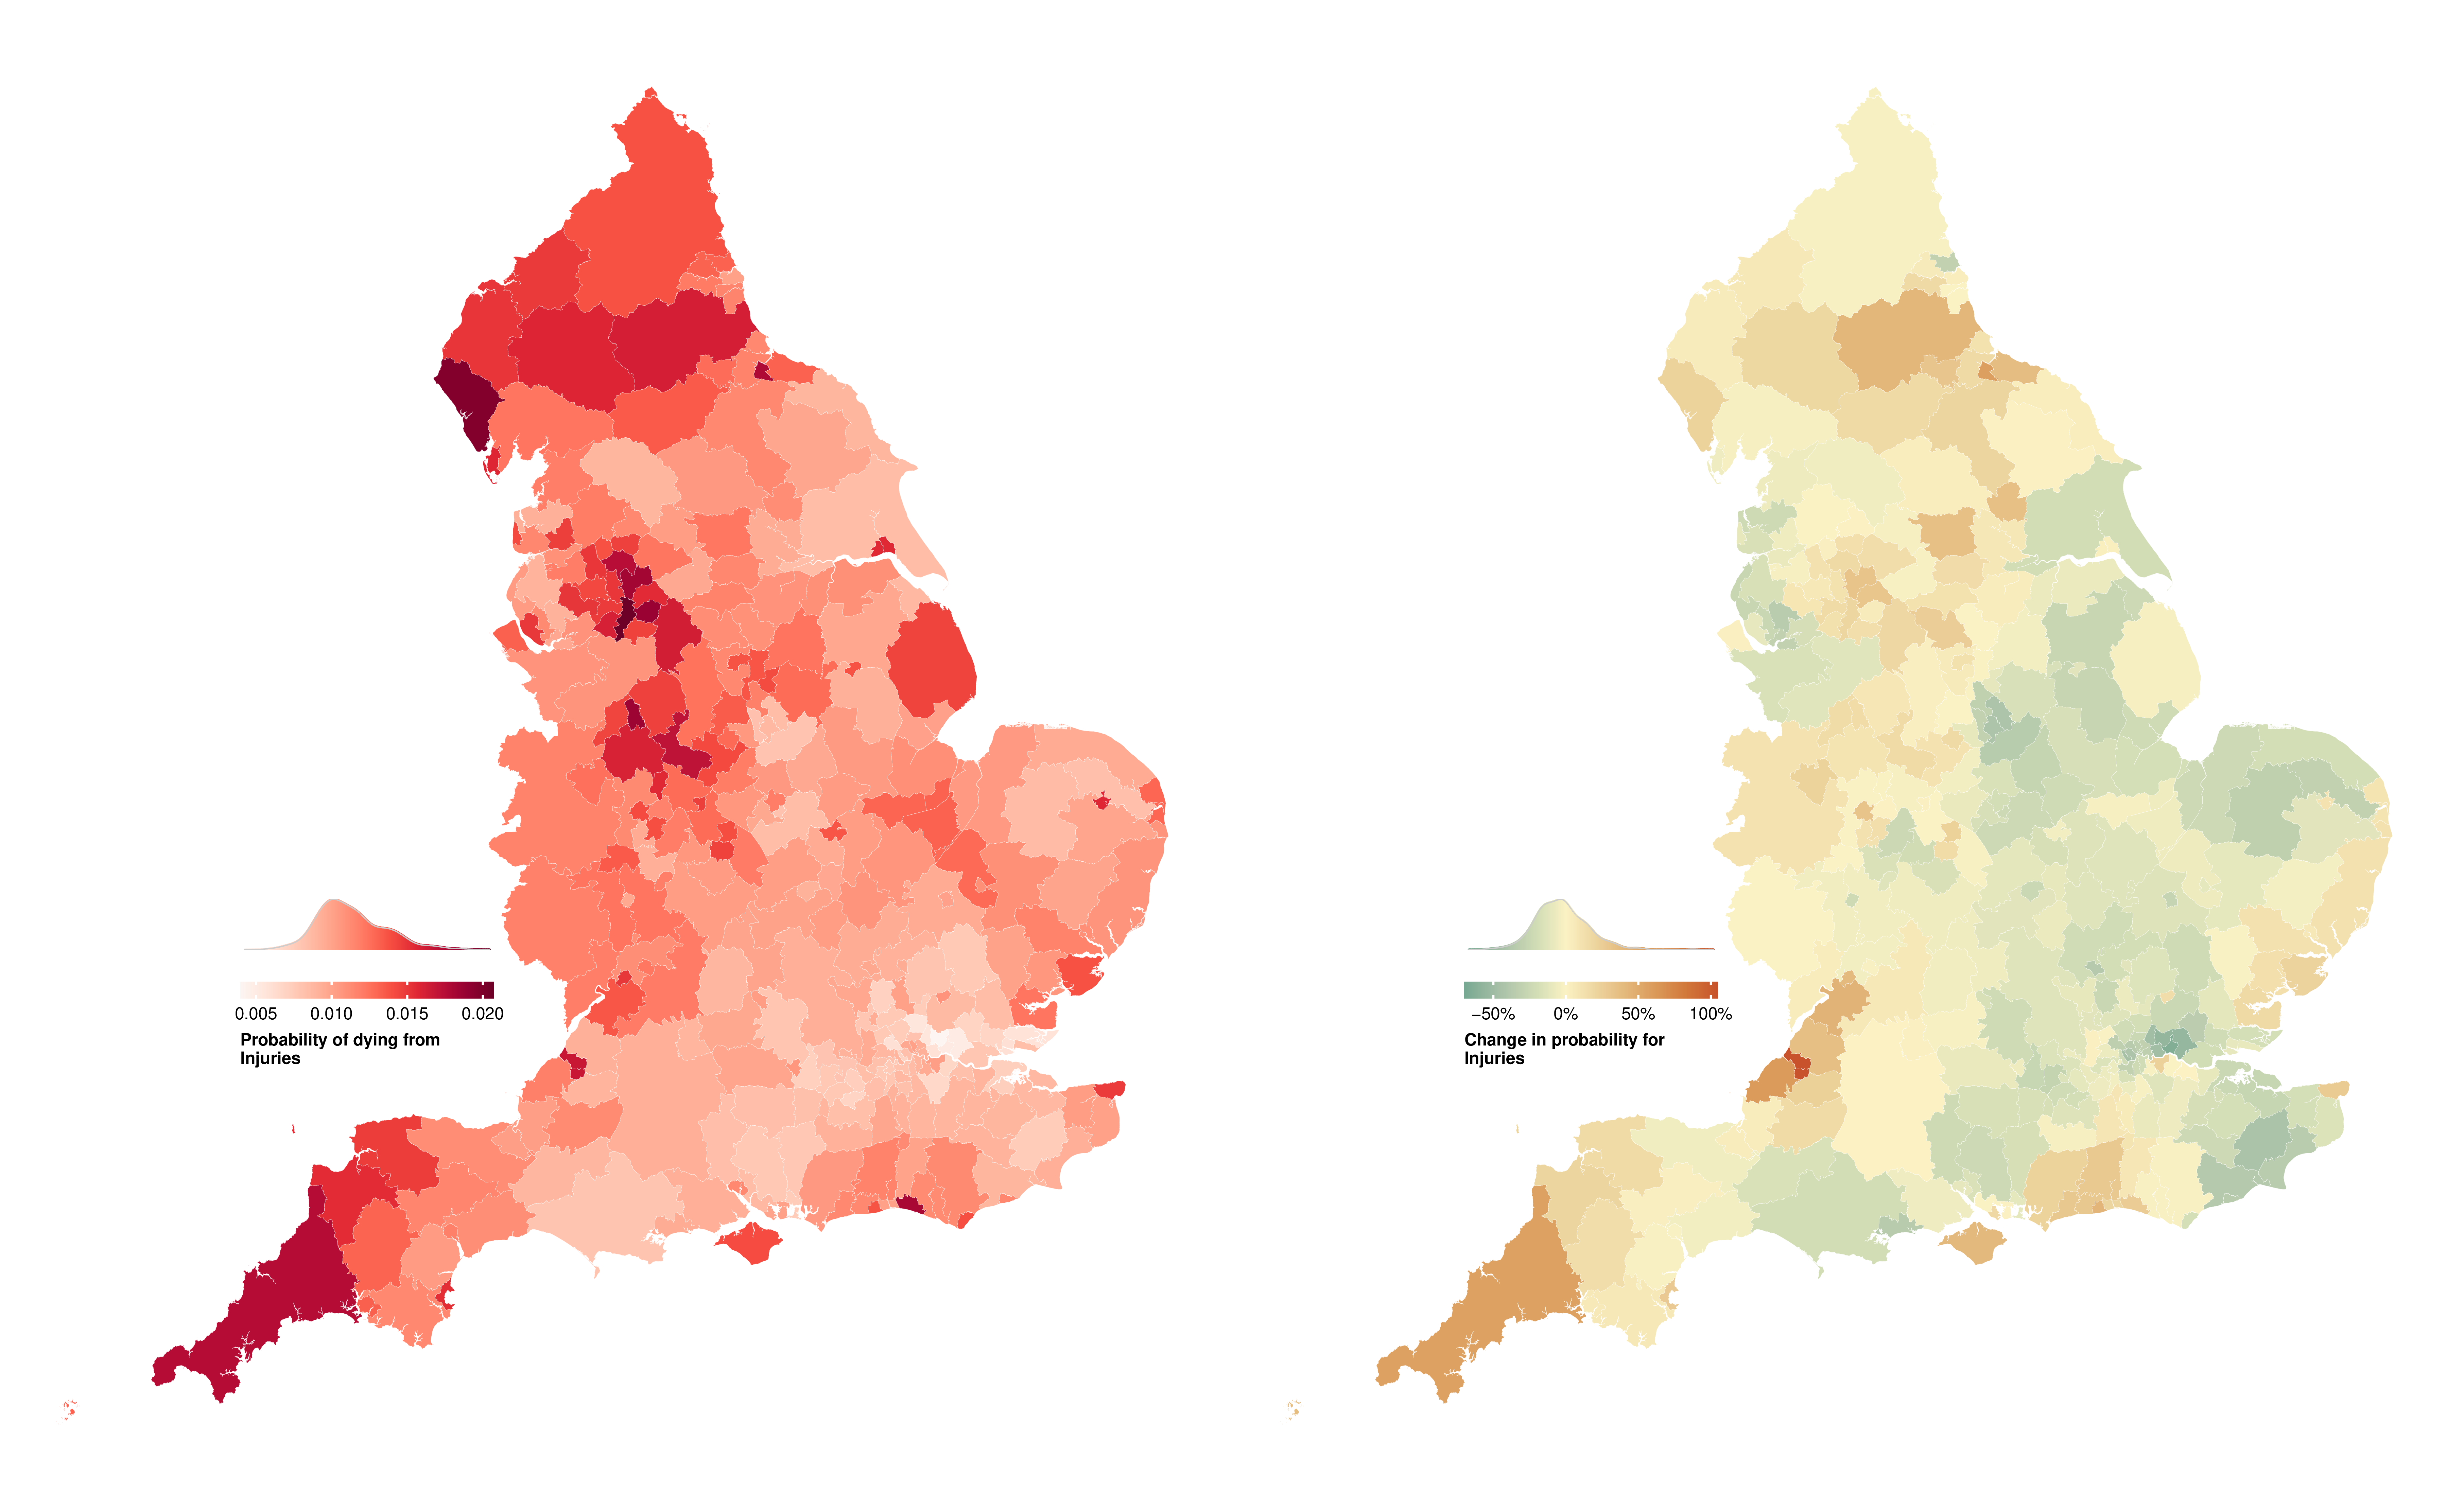
(a) Women
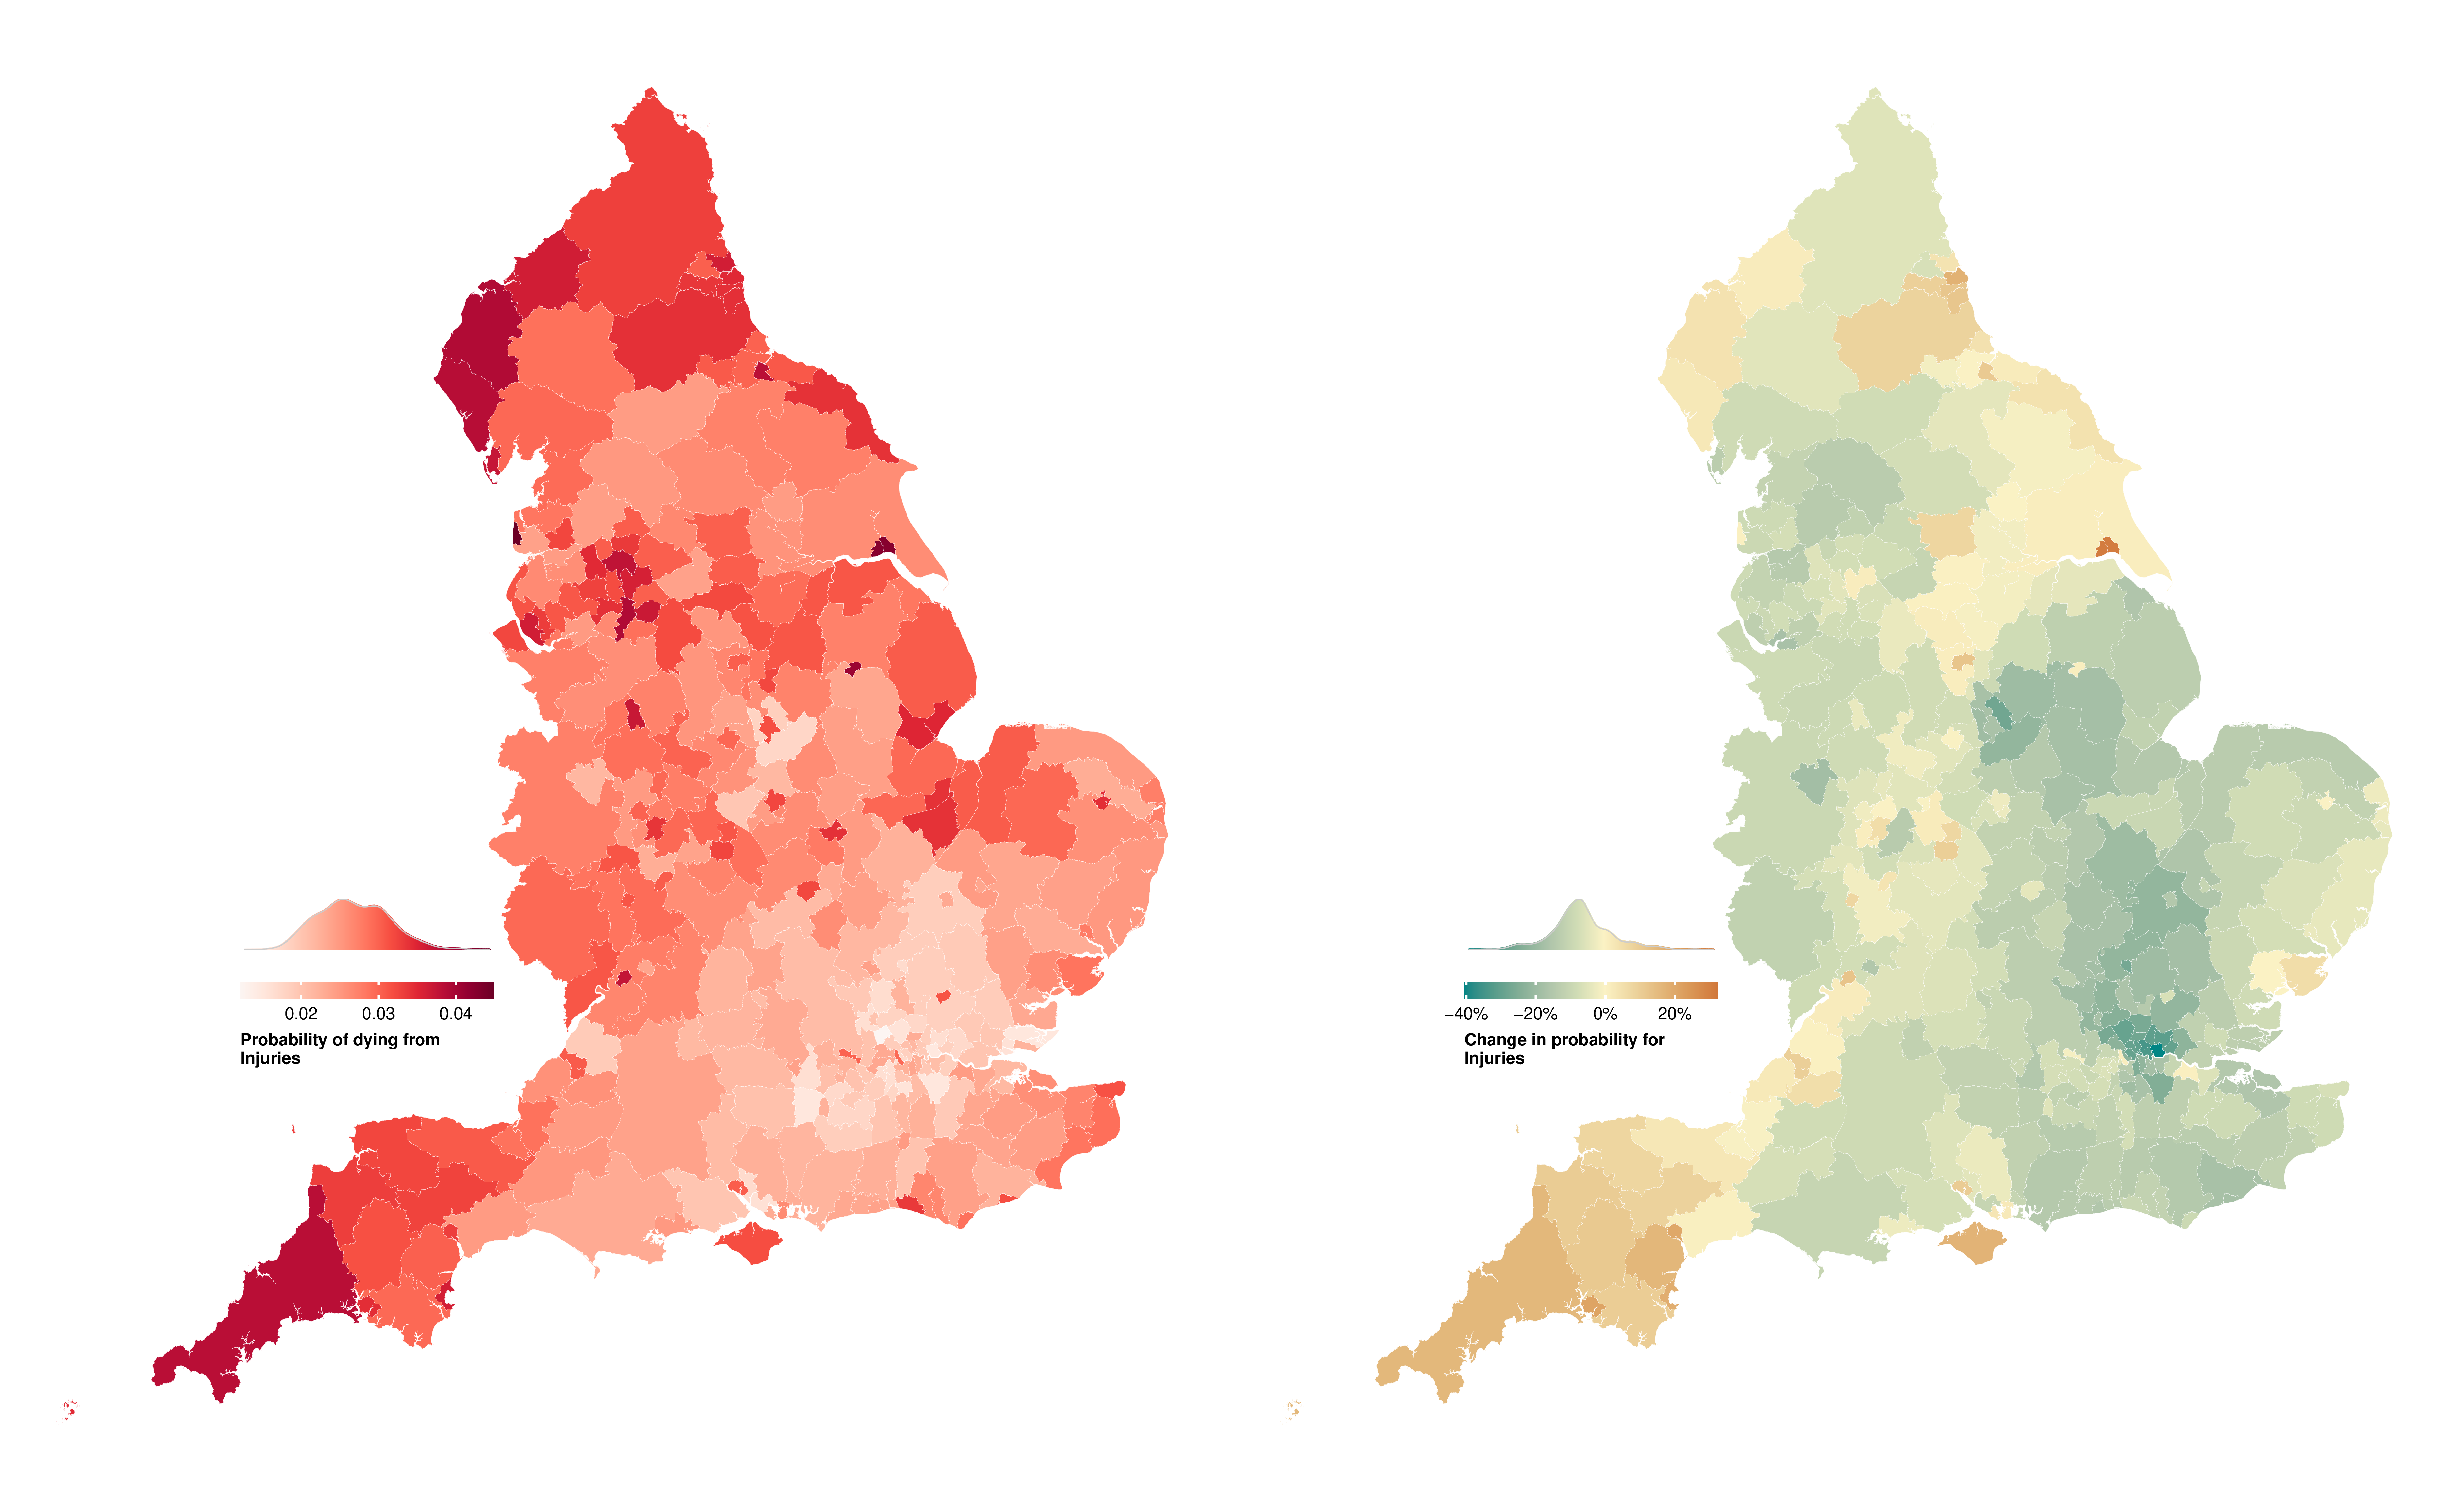
(b) Men
Figure E.26: Probability of dying from injuries between birth and 80 years of age in 314 local authority districts in England in 2019 and change from 2002 to 2019.